Outage Incidents
How ISPBox turns a down device into an outage incident, and how you open one by hand for an outage it cannot see: automatic detection, scopes (device, router, location, whole network), impact, notifications, public updates and resolution.
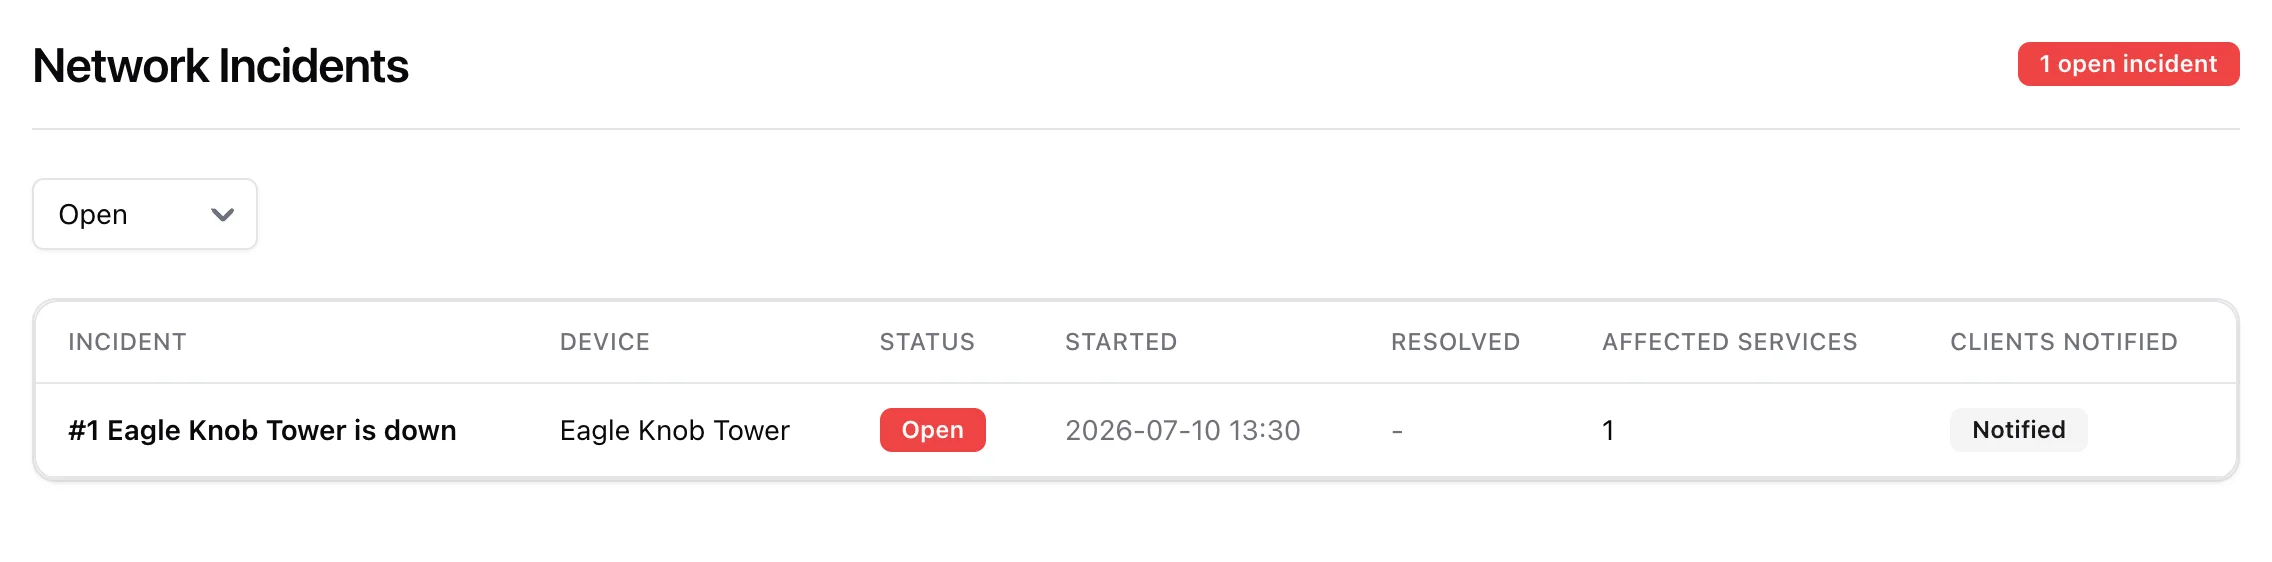
An incident is ISPBox's record of a network outage. When monitoring reports a device down, ISPBox opens an incident, works out who it affects from your network map, and (if you let it) tells those customers - then closes the loop when service is restored. This is the operator's outage console: Network Map > Incidents. It is part of the Monitoring feature and needs the network maps view permission.
1. How an incident opens
An incident starts in one of two ways: monitoring detects it, or you open it by hand. Automatic first.
Most incidents are created automatically. When a monitored device (see Network Monitoring) stays down past your grace period, ISPBox confirms the outage and opens an incident. Two things make this smart rather than noisy:
- Impact from topology - ISPBox reads the network map to find every service downstream of the failed device, so the incident already knows who is affected.
- Root-cause grouping - if a device that fails sits below another device that is already down, the new one is filed as a child of the existing incident instead of a separate alert. One tower failure is one incident, not fifty.
If auto-notify is on and enough services are affected, customers are messaged the moment the incident opens.
For an outage the panel cannot see - a planned dig, a power cut at a tower nobody monitors, a workspace with no network map at all - open one by hand instead. That is the next section.
2. Opening an incident by hand
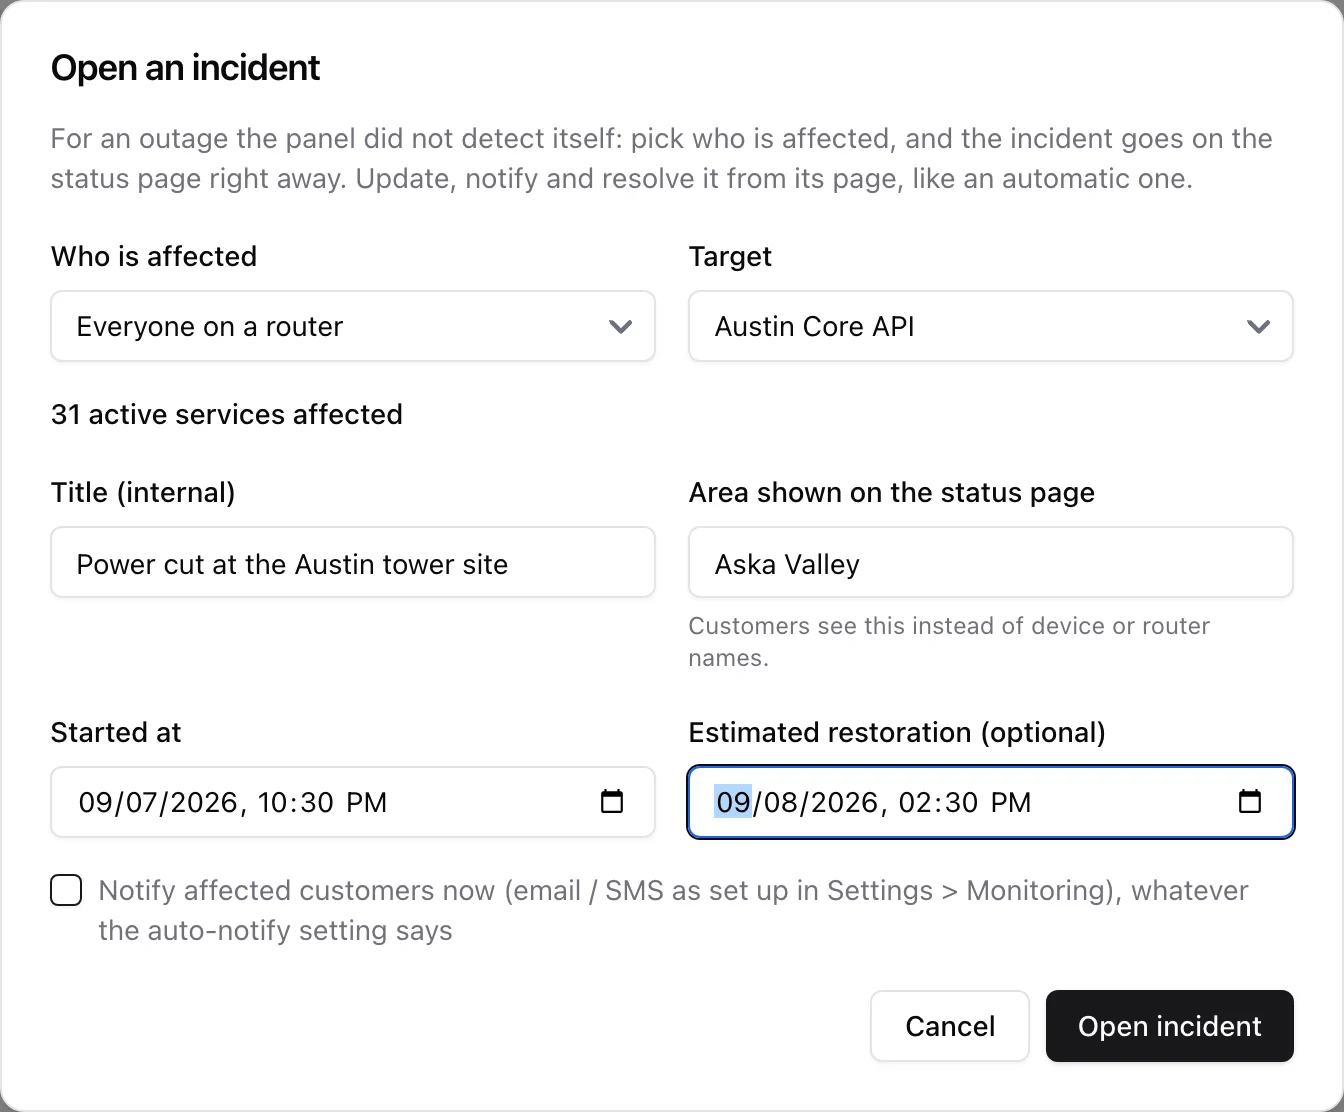
Open incident sits at the top of the incidents page (it needs the network maps manage permission). The dialog asks who is affected first, because that is what everything else follows from:
- A map device and everything behind it - the same scope an automatic incident uses: the device plus everyone downstream of it on your network map.
- Everyone on a router - every active service authenticating through that router. Use this when a site is dark and you have no map.
- Everyone in a location - every active service in one service location.
- The whole network - an upstream failure that takes everybody out.
Only the scopes your workspace can actually use are offered: the device scope needs map devices, the router scope needs routers, the location scope needs more than one location. The whole network is always there, so even a workspace with no map and no monitoring can put an outage on its status page.
As soon as you pick a target, ISPBox counts the impact and tells you: "31 active services affected". It resolves them exactly the way bulk compensation does, so the people who are notified are the people who would be compensated. If the answer is zero, the incident still opens, you are simply told there is nobody to notify.
The rest is optional:
- Title (internal) - what your team sees in the list. Left empty it becomes "<target> is down".
- Area shown on the status page - what customers see instead of a device or router name, e.g. "Aska Valley". Fill this in if the status page is public.
- Started at - defaults to now; set it back if the outage began before you got to a keyboard.
- Estimated restoration - published as the ETA.
- Notify affected customers now - sends the outage email and SMS immediately, whatever the auto-notify rule in Settings > Monitoring says. Leave it unticked and the normal rule applies.
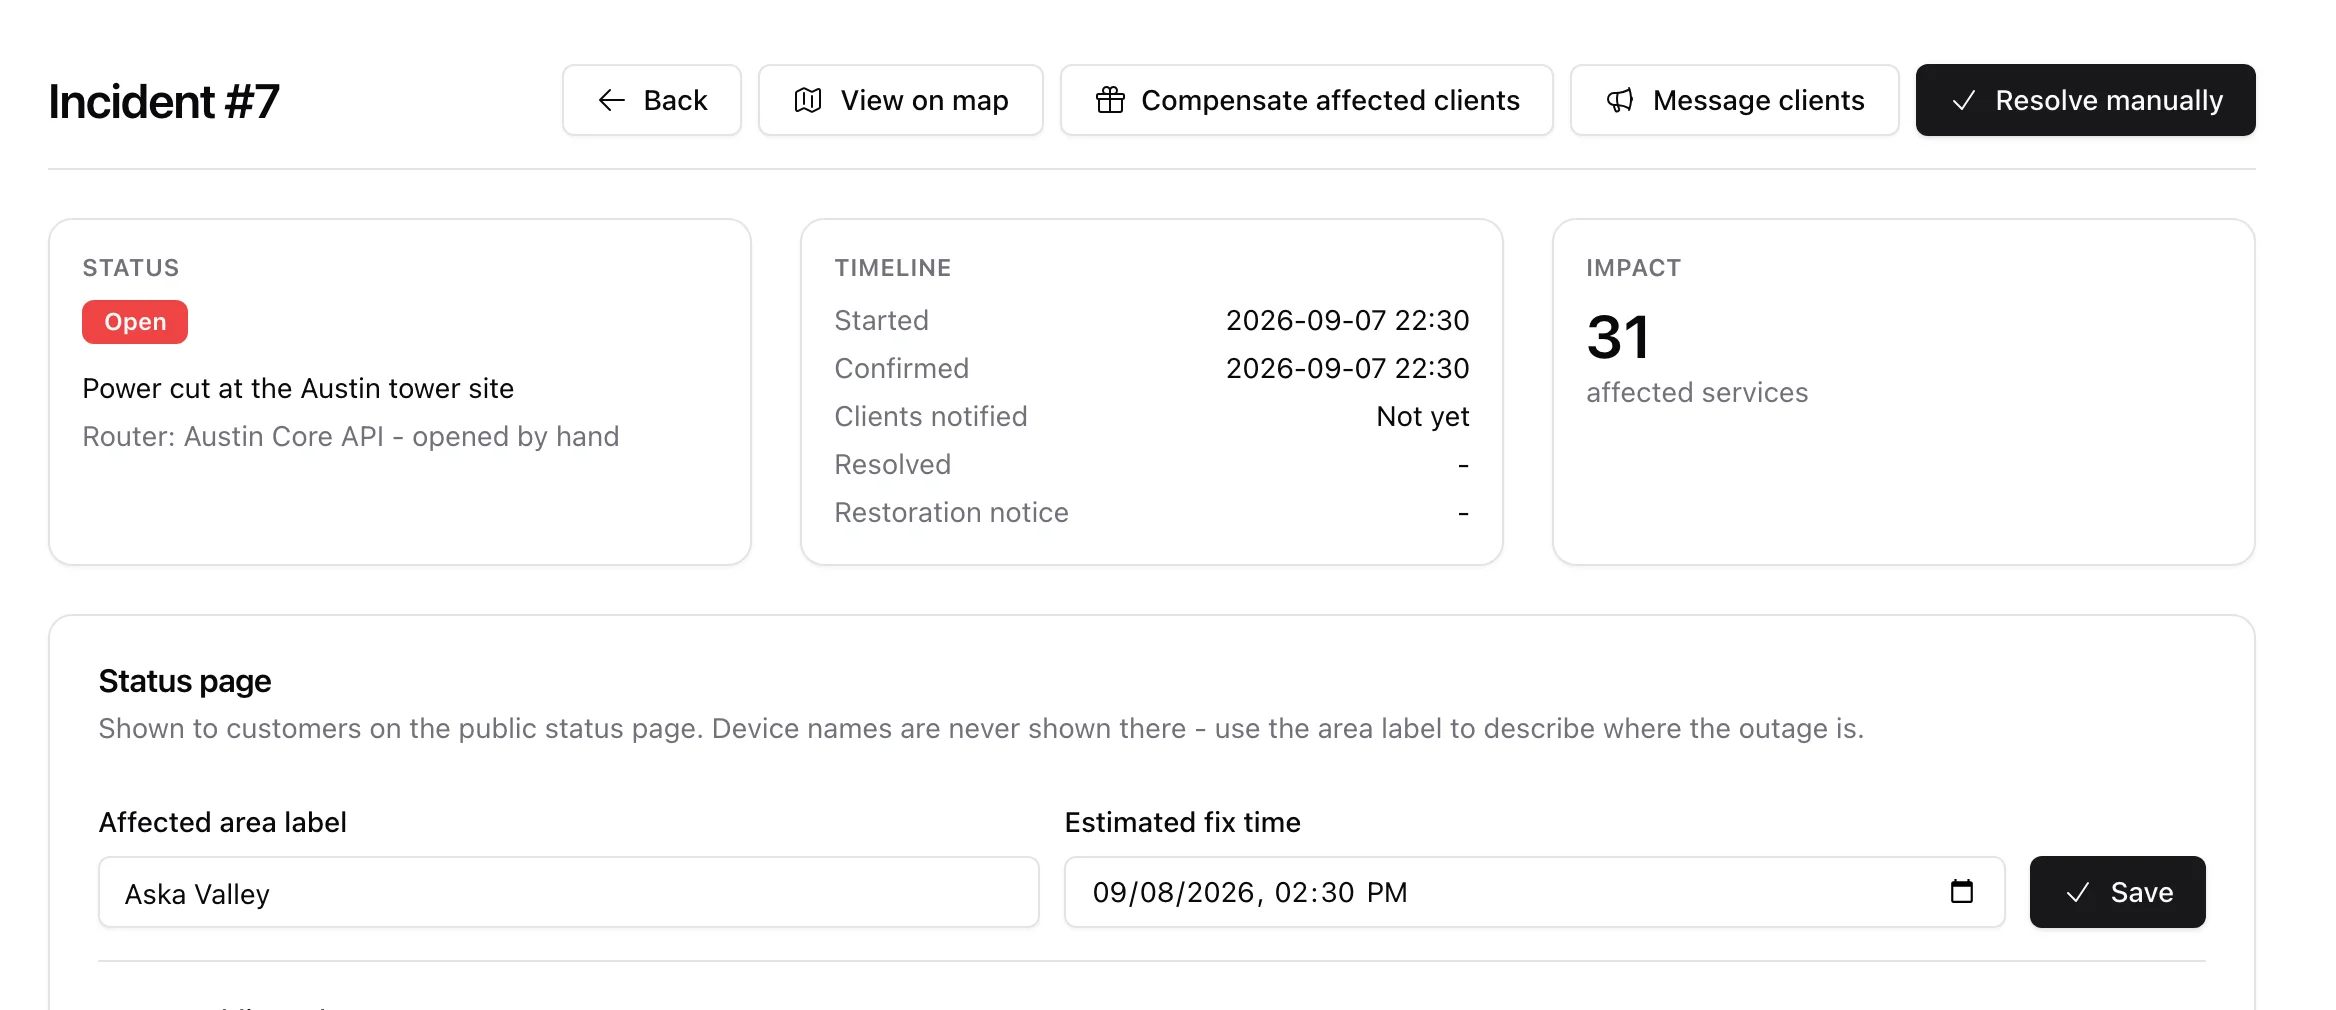
Saving takes you straight to the incident, which from that moment behaves like any other one: it is on the status page immediately, it takes public updates and compensation, and it is resolved from the same button. Its header says where it came from: Router: Austin Core API - opened by hand.
Two things a manual incident does not do. It is never auto-resolved - monitoring closes what monitoring opened, so you resolve this one with Resolve manually when the power is back. And you cannot open two for the same scope: ask for a second incident on the same router and ISPBox points you at the one that is already open, so an outage is never reported twice.
The AI assistant can do the same thing from a chat: its open-incident tool takes the identical scopes, plus update-incident and resolve-incident. That path needs a connection with the network.write scope.
3. The incidents list
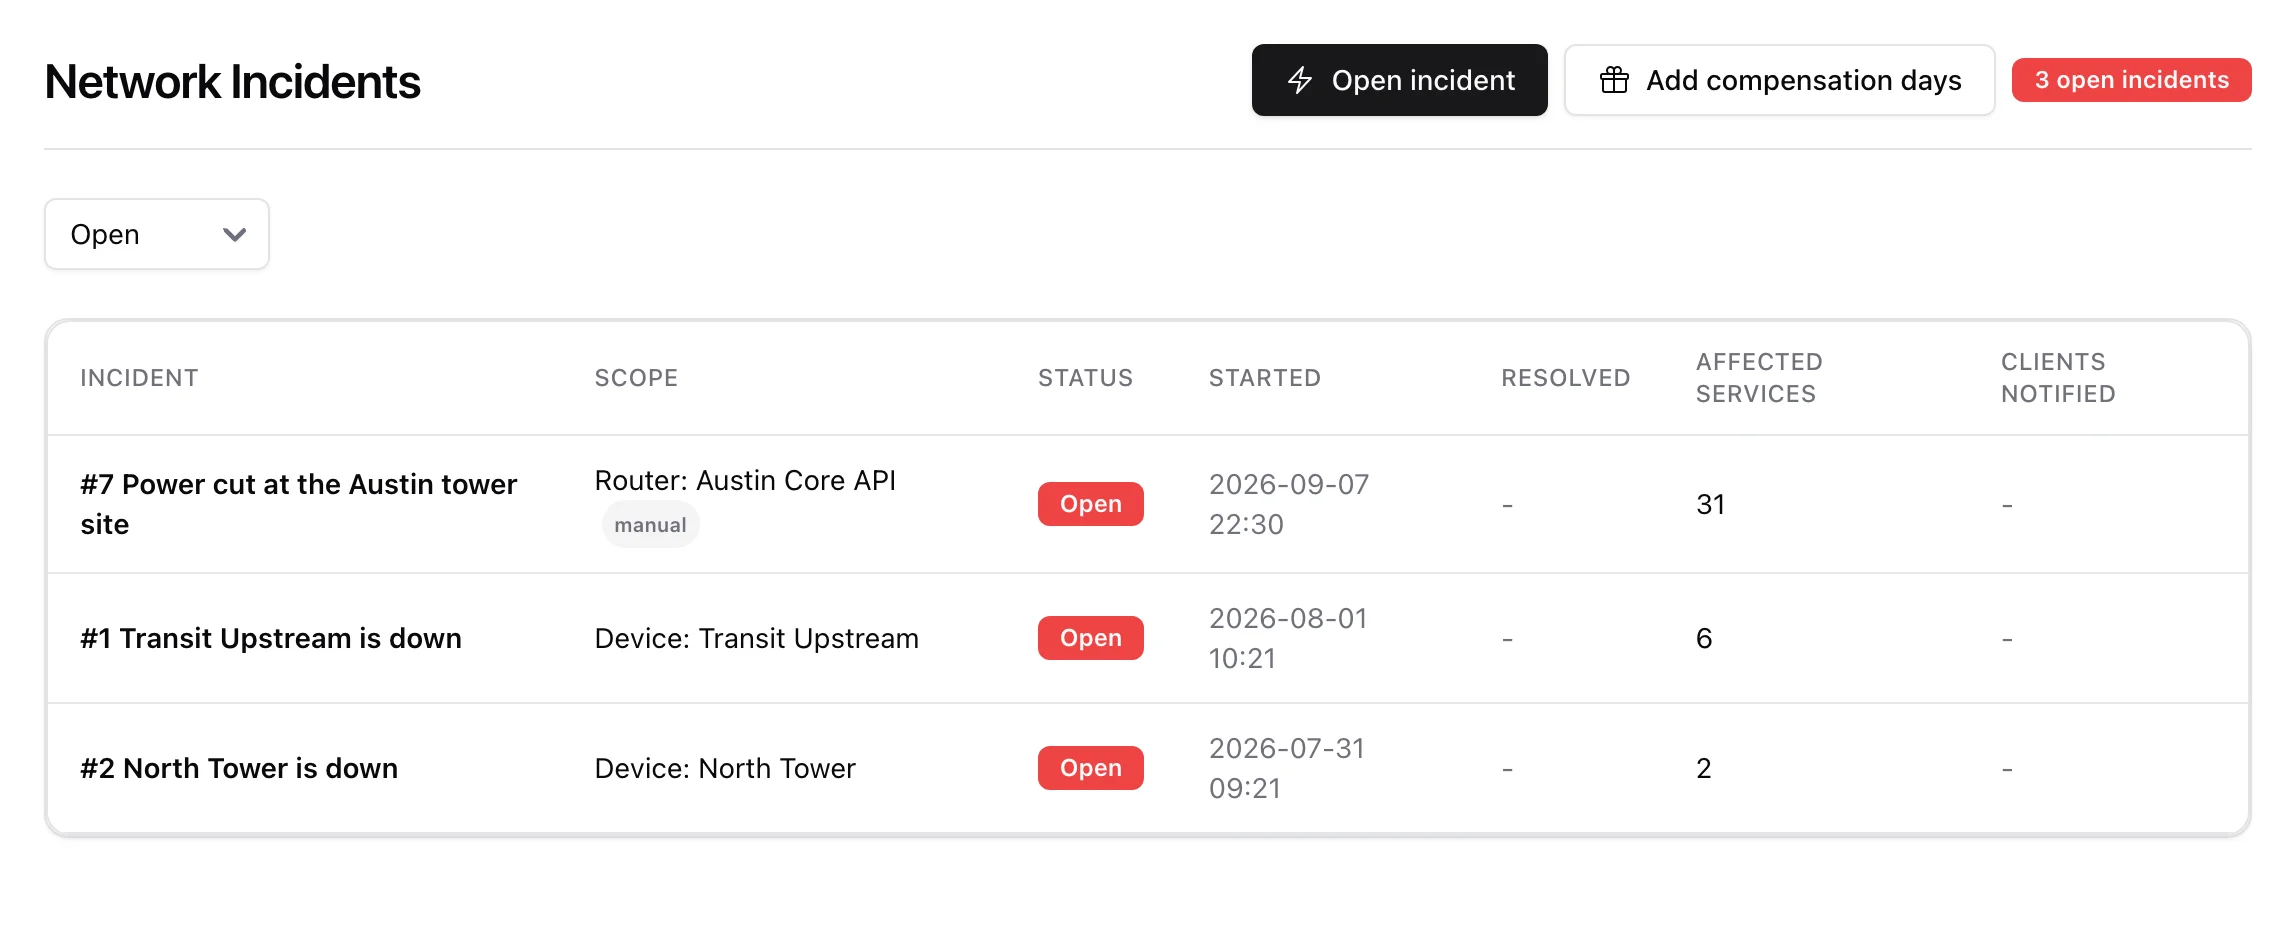
The list shows every incident newest first, with a filter for Open, Resolved or All. The Scope column says who each one covers - "Device: North Tower", "Router: Austin Core API", "Location: Riverside" or "Whole network" - and an incident you opened yourself carries a small manual tag. The rest of the row gives the status, when it started and resolved, how many services are affected, and whether customers were notified; downstream incidents carry a child badge. A badge at the top tells you how many incidents are open right now (or All clear). Click a row to open it.

4. Inside an incident
The top of an incident summarises it at a glance:
- Status - open or resolved, the scope it covers (with "opened by hand" when you opened it yourself), and a link to the parent if this is a downstream child.
- Timeline - when it started, was confirmed, when customers were notified, and when it resolved.
- Impact - the number of affected services, plus any downstream child incidents.

Further down, Affected clients lists exactly whose service is out - name, service, package and contact details - alongside a notification log of every email/SMS sent and any related tickets.
5. Keeping customers informed
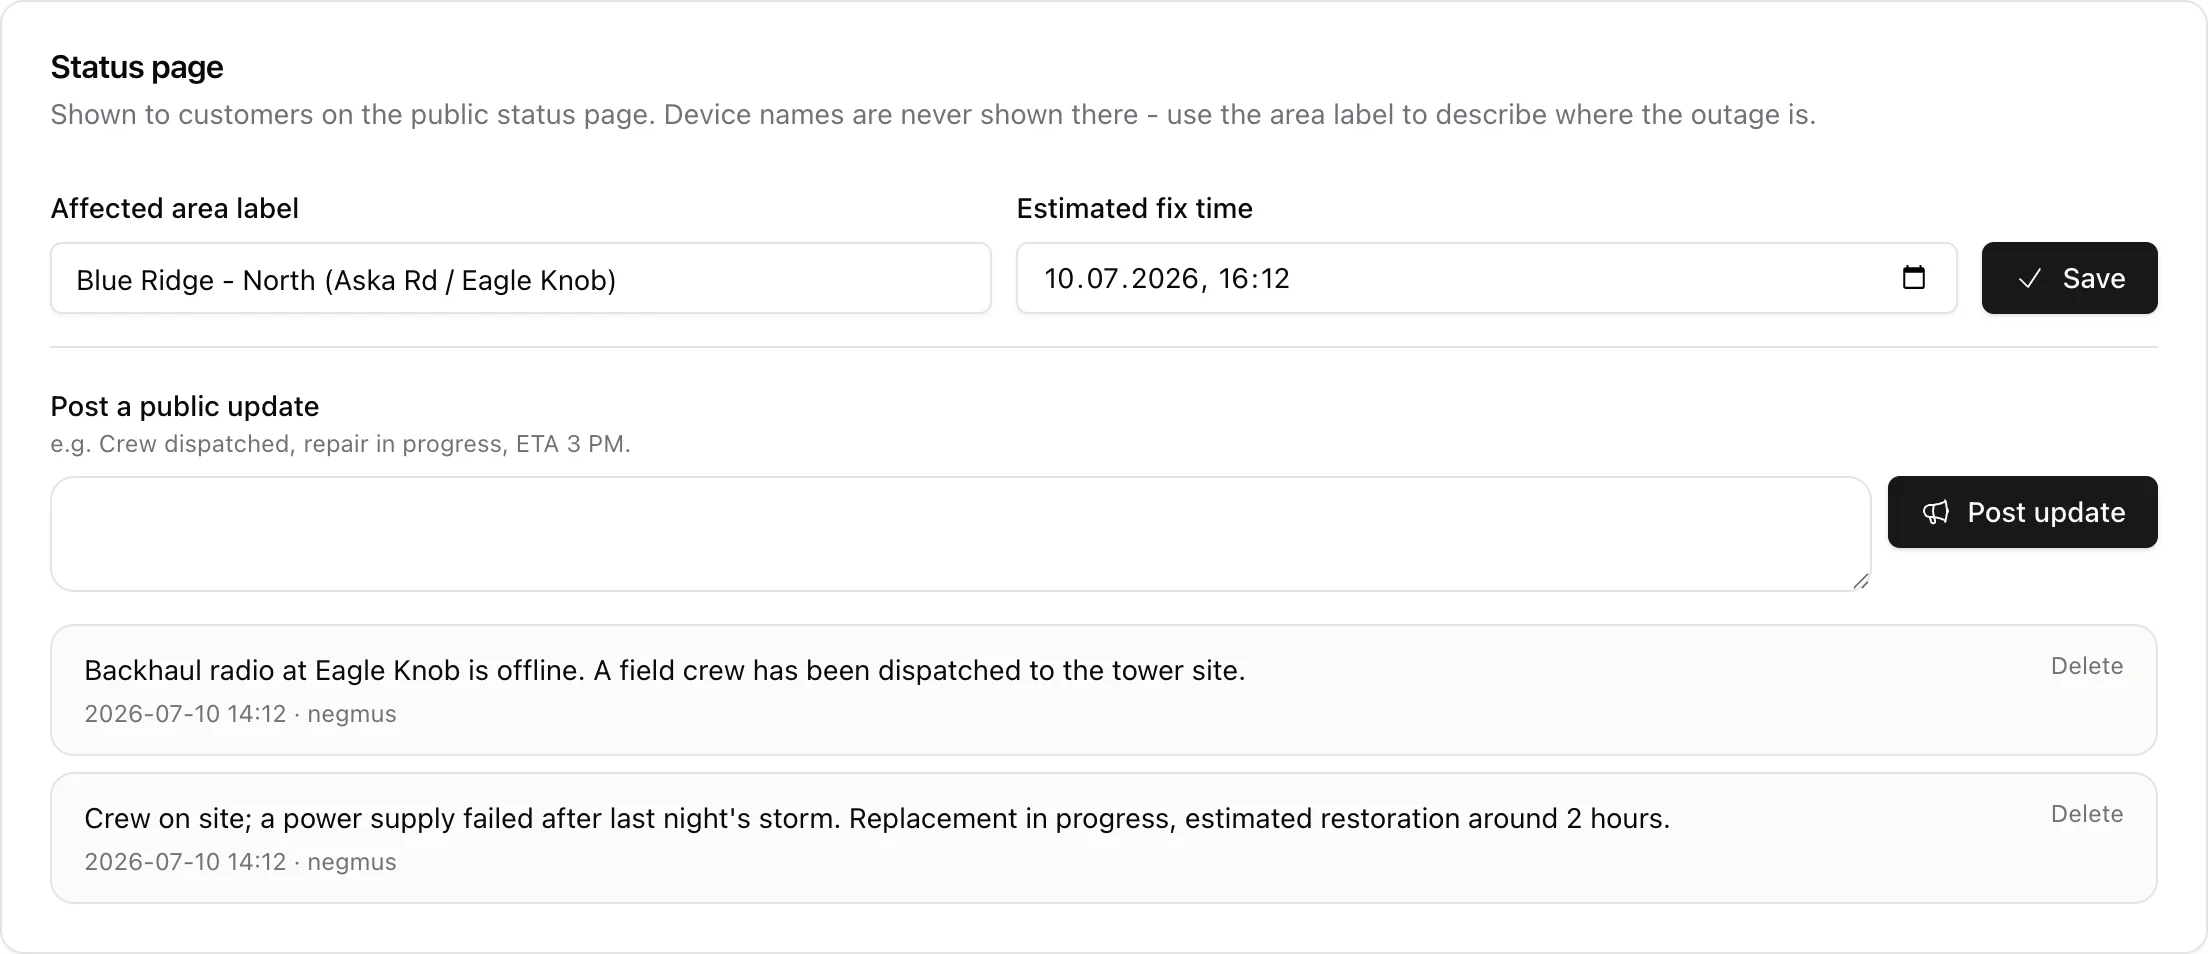
The Status page card controls what customers see on your public status page - device names are never shown there, so you describe the outage with:
- Affected area label - e.g. "North Village area" - so customers recognise it without you leaking network internals.
- Estimated fix time - shown publicly as your ETA.
- Public updates - a running feed ("Crew dispatched", "Power supply replaced, ETA 3 PM") that appears on the status page and can be deleted if posted by mistake.
Need to reach people directly? Message clients hands off to mass messaging with the affected customers pre-selected and an outage draft ready for you to edit.
6. Resolving
When a monitored device comes back, ISPBox resolves the incident automatically (and any children that recovered with it). If it does not clear itself - or you fixed it another way, or you opened the incident by hand - use Resolve manually. If notify on restore is on, customers who were told about the outage get a "service restored" message.