The Network Map
A live map of your physical network - towers, fiber, coax and the customers they feed. How to read it, add and connect devices, use device profiles, and why topology drives outage impact.
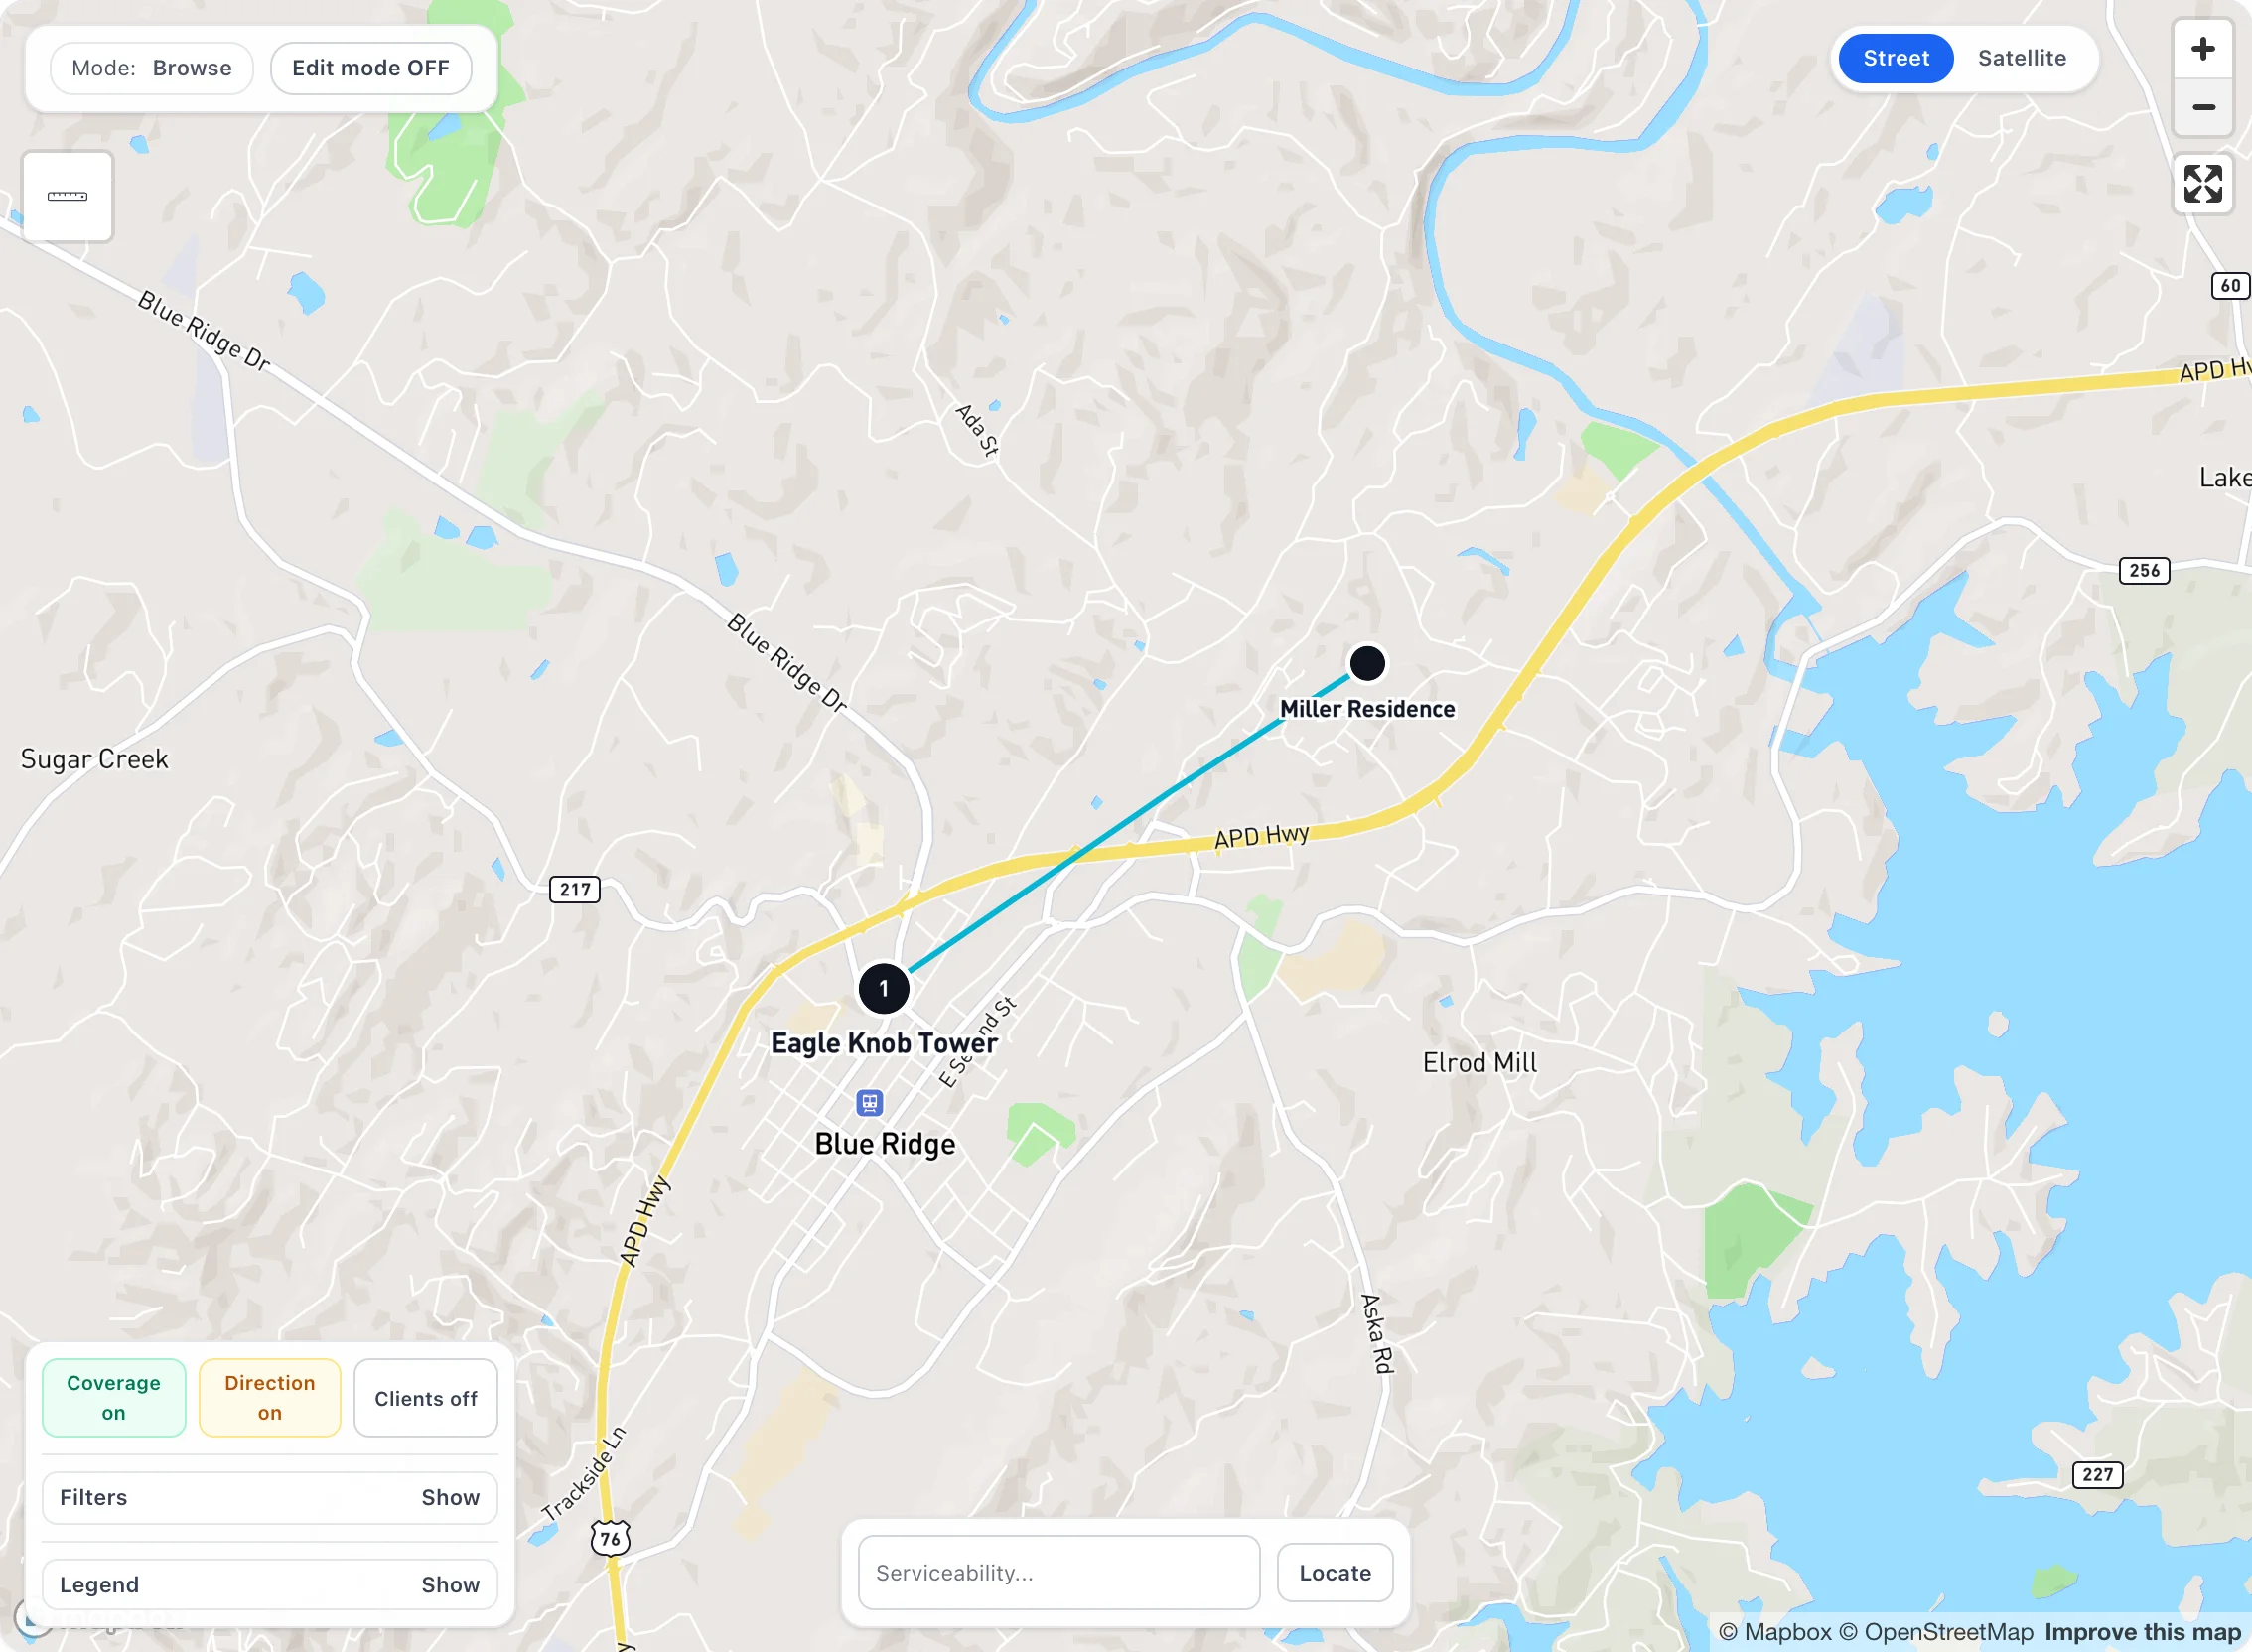
The network map is a live picture of your physical network - towers, access points, fiber and coax gear, and the customer premises they feed - drawn on a real street map. It is where you plan builds, document what is connected to what, and (together with monitoring) see at a glance who an outage affects. This guide covers how to read it, how to add and connect devices, and the tools around it.
1. Opening the map
Go to Network Map > Map in the sidebar. It opens framed on your existing network. The map is part of the Maps feature, so it needs a plan that includes premium features; if it shows [Locked], upgrade from Settings > ISPBox Plan. Viewing needs the network maps view permission; adding or changing anything needs network maps manage.
2. Browse vs Edit mode
The map opens in Browse mode - you can pan, zoom, switch between Street and Satellite, click any device to inspect it, and toggle overlays (coverage, direction, clients). Turn on Edit mode (top-left) to start placing and connecting equipment. Only staff with the manage permission see Edit mode.
3. What you can put on the map
ISPBox ships with a catalogue of device and cable types covering the common access technologies, so the map speaks your network's language:
- Wireless - Base Station (tower), Access Point, Wireless Sector (coverage wedge) and Wireless Link.
- Fiber / PON - OLT, Splitter, Splice Closure, Fiber Joint, ONT / CPE, plus Fiber Route and PON Link lines.
- Coax / HFC - CMTS, COAX Node, Amp and Tap, with Coax Trunk and Drop lines.
- General - Router, Cabinet, Internet Source, and a Coverage Zone polygon for marking serviceable areas.
Point devices (a tower, an ONT) are dropped at a location; line types (a fiber route, a wireless link) are drawn between two devices to record what connects to what.
4. Adding a device
In Edit mode, pick a device type and click the map to place it - or paste an address and let ISPBox geocode it to the right spot. Give it a name, set its status (planned, live or deprecated), and fill in any properties that matter for that type (for a PON splitter, its ports; for an OLT, its optical budget). Draw a line type between two devices to connect them.
Device profiles
If you install the same hardware over and over, save it once as a device profile under Network Map > Device Profiles. A profile pairs a device type with default properties (model, port count, and so on), so placing a new unit is one click with everything pre-filled - no re-typing the same specs.
5. Topology powers outage impact
The connections you draw are not just documentation. Because the map knows a customer's ONT hangs off a splitter, which hangs off an OLT at a tower, ISPBox can trace downstream from any device. When monitoring reports that tower down, the map already knows every service it feeds - which is exactly how outage incidents work out who is affected, and how a single root-cause outage is grouped instead of firing dozens of duplicate alerts.
6. Live device status
Connect network monitoring (built-in checks, or LibreNMS / Zabbix) and each mapped device can carry a live up / down status, so the map doubles as a real-time health view of your plant, not just a static diagram.
7. Locations and export
- Locations (Network Map > Locations) lists your mapped sites in a table - handy for jumping straight to a tower or reviewing what you have deployed.
- Export KML / KMZ (Network Map > Export) downloads your network as a standard KML/KMZ file you can open in Google Earth or hand to a GIS tool or contractor.