Reports & Analytics
Nine read-only dashboards that turn your invoices, payments, clients and traffic into the numbers you run on: payments, billing trend, AR aging, tax summary, package mix, revenue by location, client growth, top data users and tickets - five of them with CSV export.
ISPBox ships nine read-only reports that turn your invoices, payments, clients and traffic into the numbers you actually run the business on. They all live under Reports in the sidebar, they are all tenant-scoped, and they all require the reports view permission - so you can give an accountant the numbers without giving them the client database.
Nothing here is editable: every report reads from live data, so a payment recorded a minute ago is already in it.
1. Payments
Reports > Payments is the transaction log: every payment with its client, amount, source (Stripe, cash, bank transfer, manual, and so on) and status. It opens on the current month and you can set any From / To range, search by client, filter by status and source, sort any column, and change the page size. Use it to answer "did this customer's payment land?" and to reconcile a day's takings.
2. Billing Trend
Invoiced versus collected per month, with the collection rate and an on-time payment count. Pick 6, 12 or 24 months. This is the one report to look at monthly: a collection rate drifting down is the earliest signal that your reminders or suspensions need attention.
3. AR Aging
Who owes you what, and for how long. One row per client, each open invoice's remaining balance dropped into a bucket: Current, 1-30, 31-60, 61-90 and 90+ days past due, with a total. There is no date selector because the report is always "as of today". Work it top-down - the 90+ column is where money goes to die.
4. Tax Summary
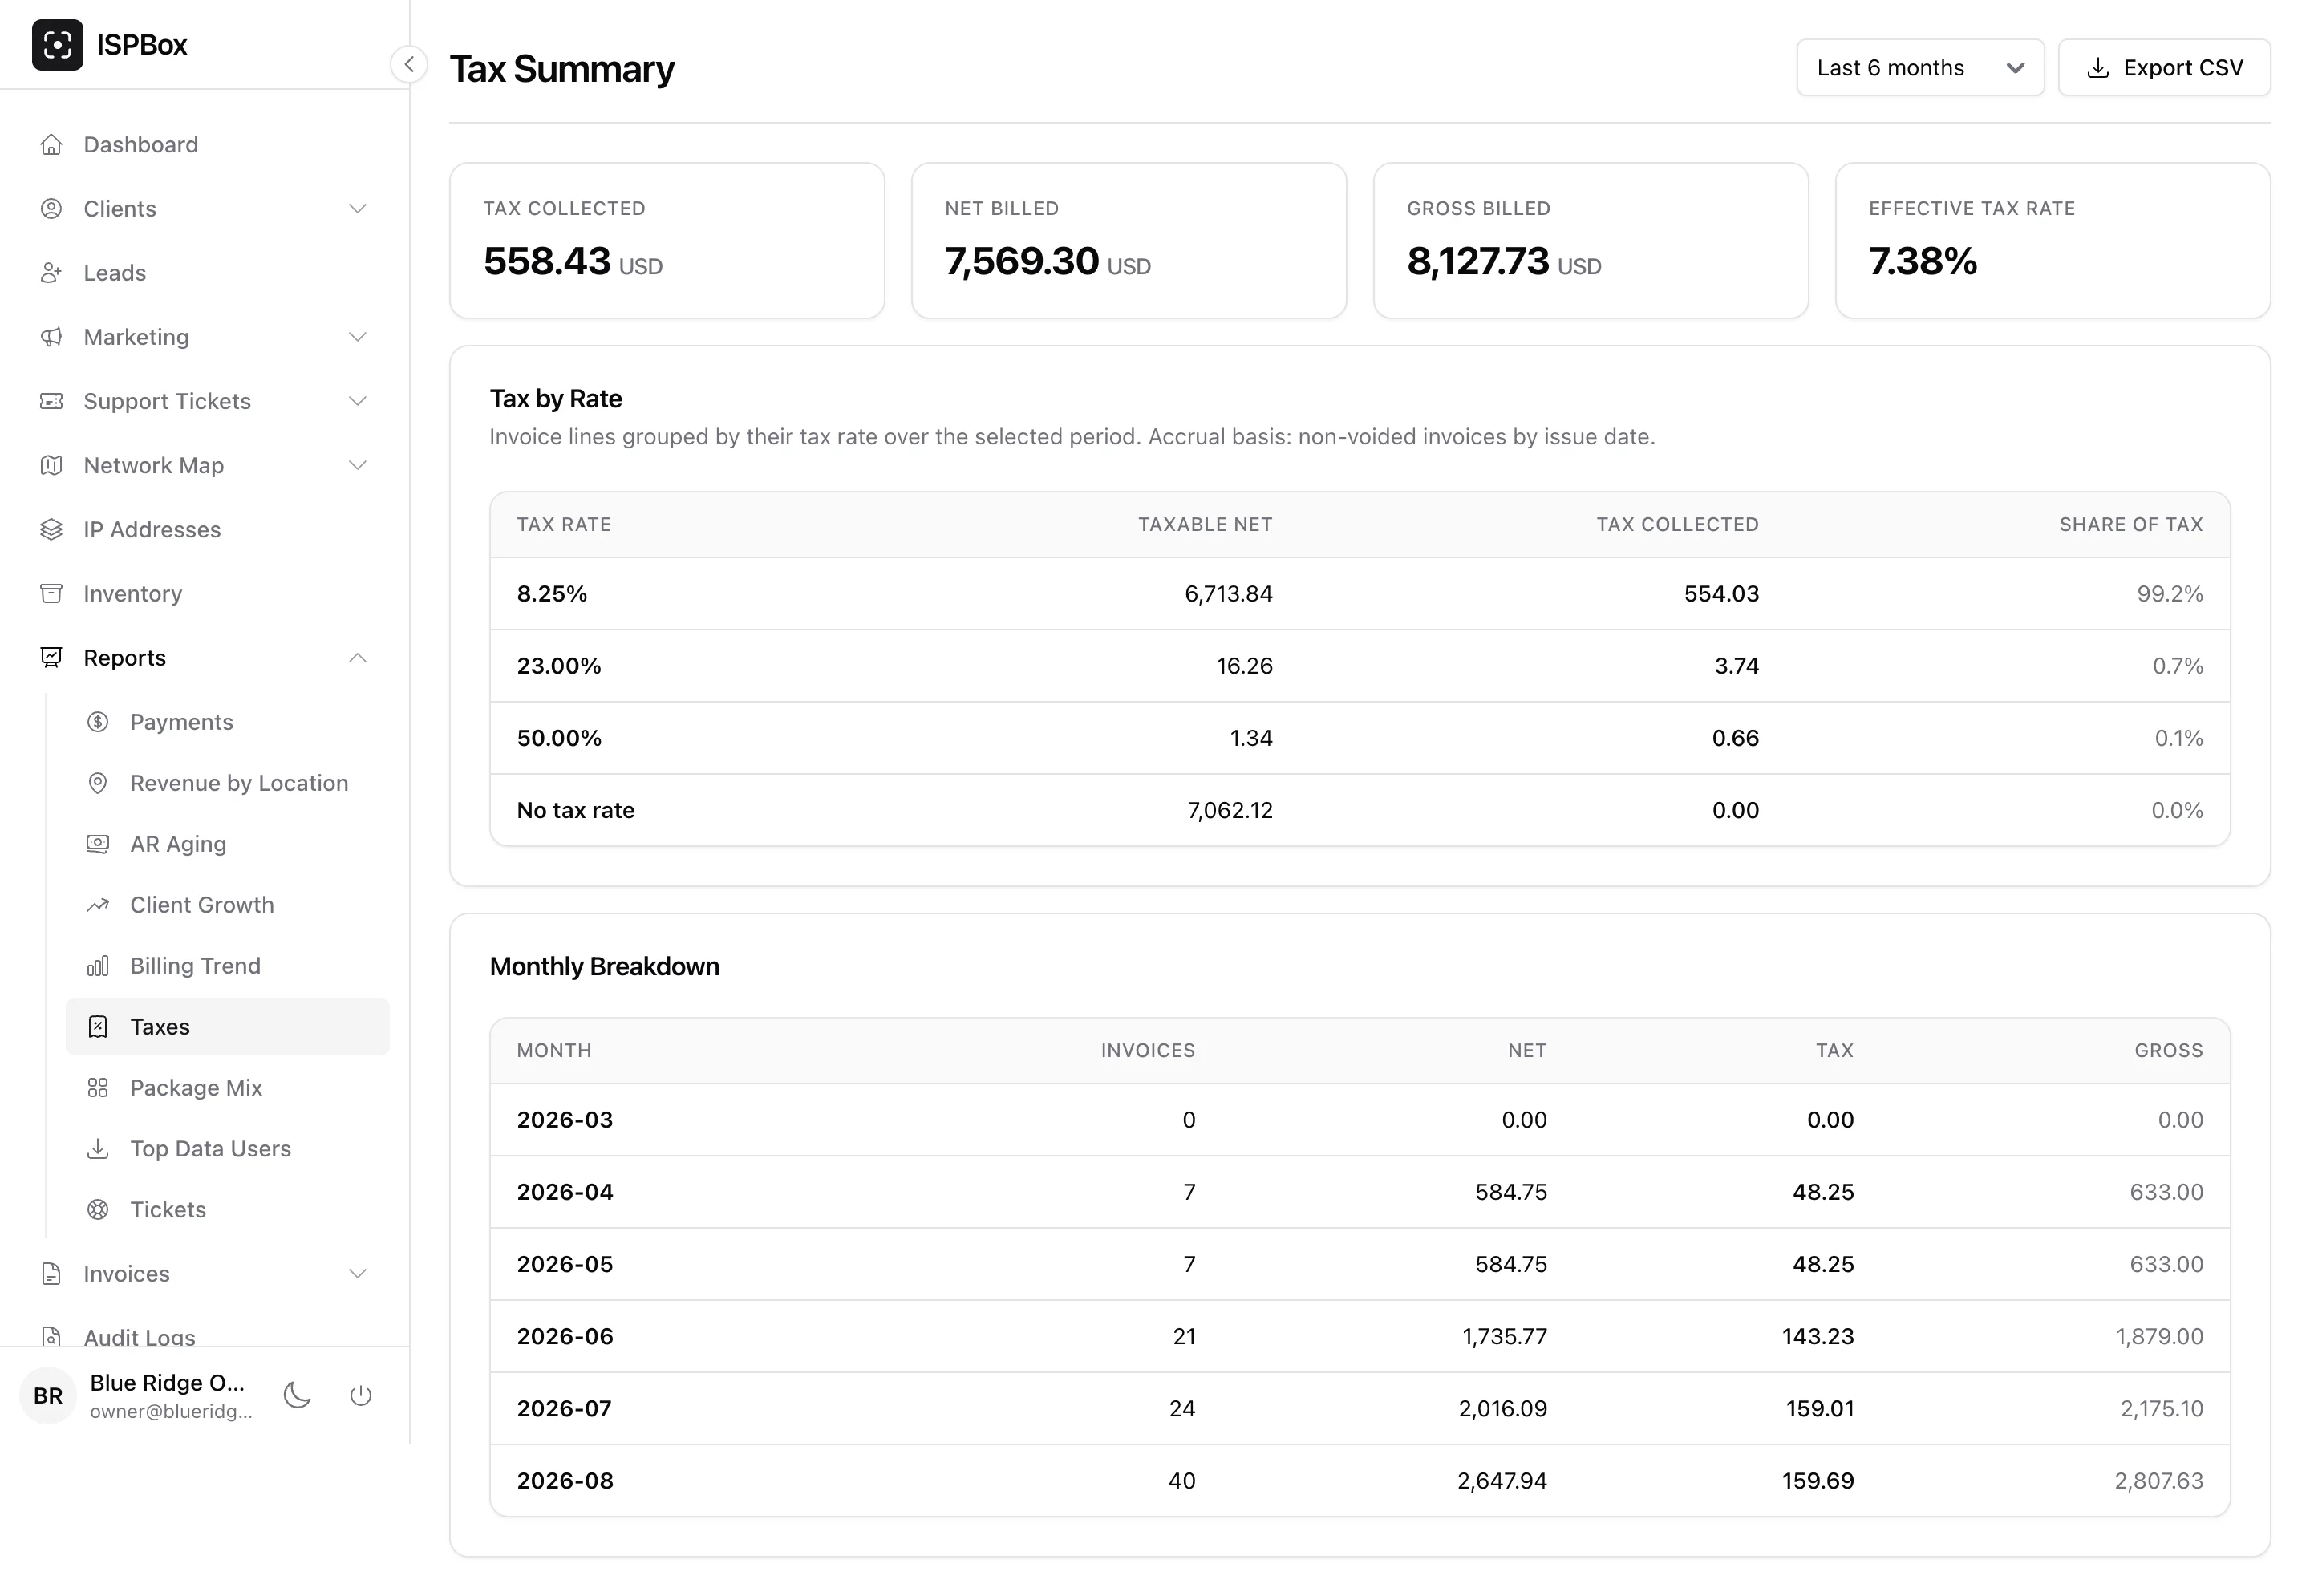
What you have charged in tax and where it came from - the report an accountant asks for. It gives you four figures at the top (tax collected, net billed, gross billed and the effective tax rate), then two tables:
- Tax by Rate - invoice lines grouped by the rate applied to them, with taxable net, tax collected and each rate's share of the total. Lines with no rate set are gathered into a No tax rate row, which is a quick way to spot packages or one-off charges that are missing a tax rate.
- Monthly Breakdown - invoices, net, tax and gross per month.
Both are on an accrual basis: non-voided invoices counted by issue date, not by when the customer paid. Range is 6, 12 or 24 months, and there is a CSV export for your bookkeeper.
5. Package Mix
How many active services sit on each package and what each contributes to MRR. Non-monthly packages are normalised to a monthly figure (a yearly package counts as a twelfth of its price per month), so quarterly and annual plans do not distort the mix. Read it before a price change: it shows which plans actually carry your revenue.
6. Revenue by Location
Collected revenue grouped by service location over 6, 12 or 24 months, so you can compare towers, villages or apartment blocks and see where expansion paid off. Exports to CSV.
7. Client Growth
New versus churned clients per month over 6, 12 or 24 months, plus a net figure and a churn rate. Churn is taken from the client status history rather than guessed from deletions, so a customer you suspended and later reactivated is counted honestly.
8. Top Data Users
The 50 heaviest services for a chosen month (a month picker, not a range), built from RADIUS accounting traffic, with the tenant total and how many services reported traffic at all. This is your capacity-planning and fair-use conversation starter - and it only has data if your routers are sending accounting to ISPBox.
9. Tickets Summary
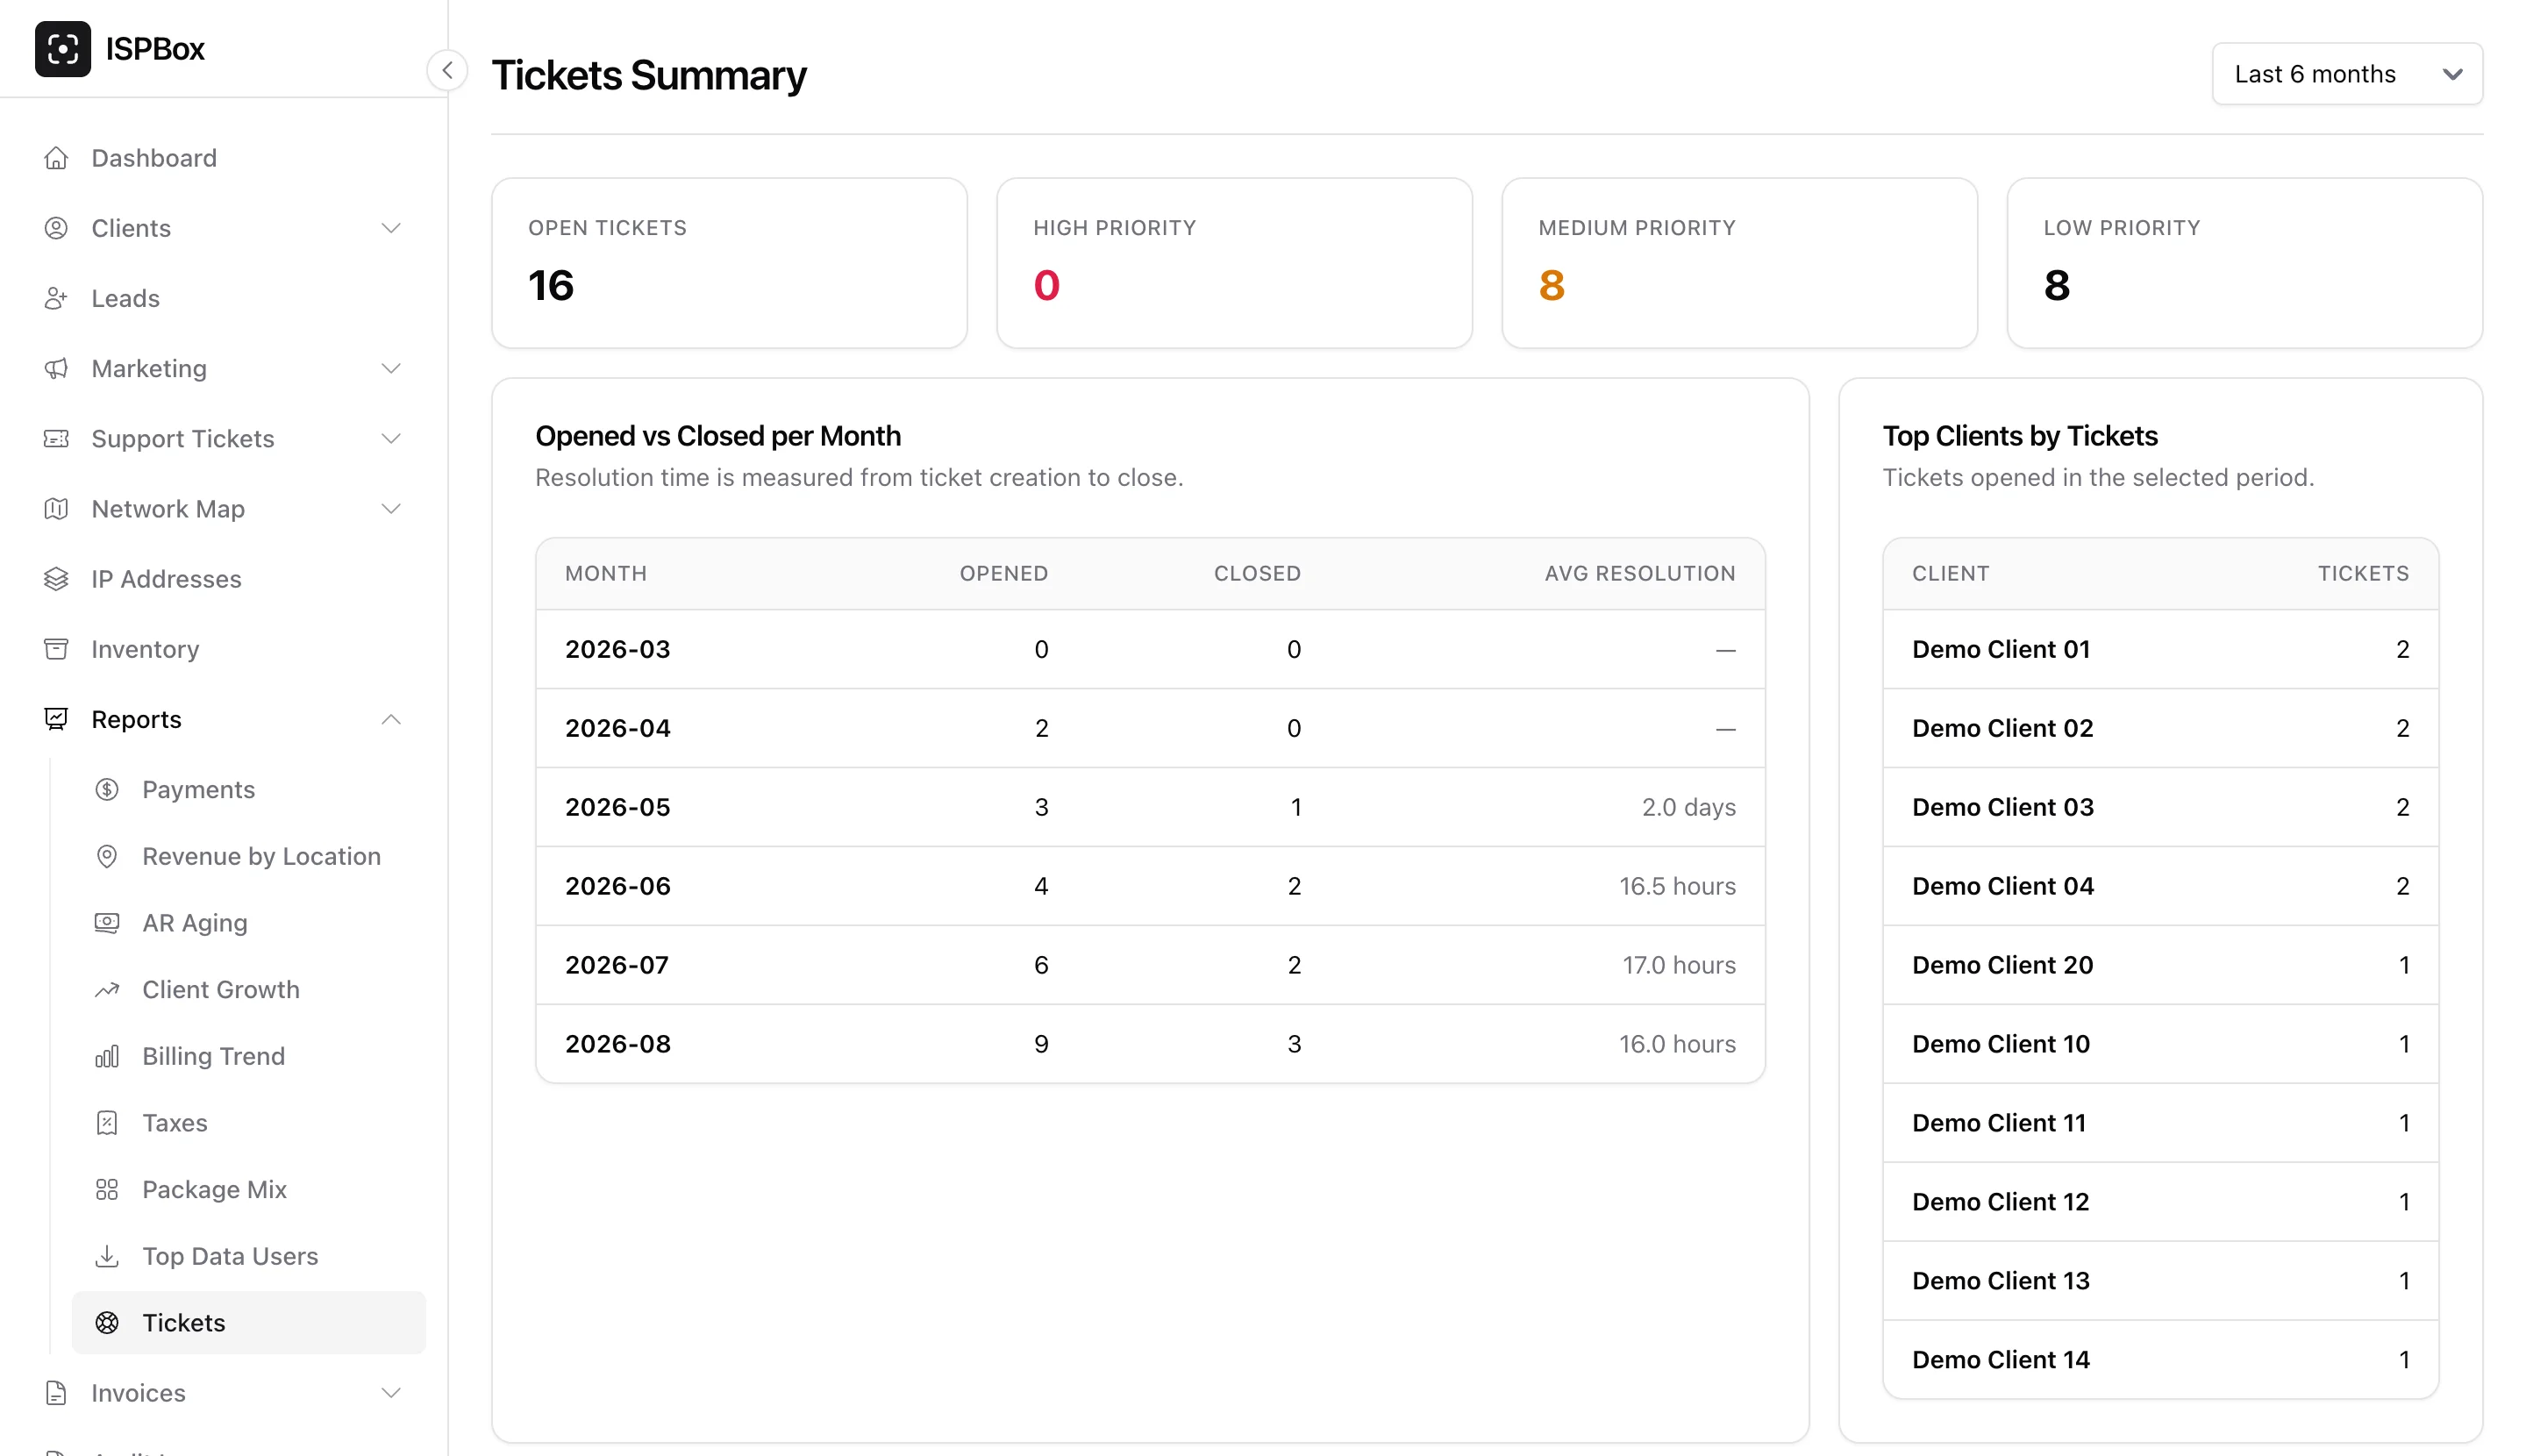
Support load instead of money. At the top: open tickets and how they split across high, medium and low priority. Below: opened versus closed per month with the average resolution time (measured from creation to close), and top clients by tickets for the selected period - the list that tells you which customer needs a site visit rather than another phone call. Range is 6, 12 or 24 months.
CSV export
Five reports stream a CSV of exactly what you are looking at, filters included: Payments, Billing Trend, AR Aging, Revenue by Location and Tax Summary. Package Mix, Client Growth, Top Data Users and Tickets Summary are on-screen only for now.