How Link Attribution and Diagnoses Work
The probe measures hosts; everything said about a link is a conclusion. How clean and degraded are decided, how the root link is picked, and what the diagnoses mean.
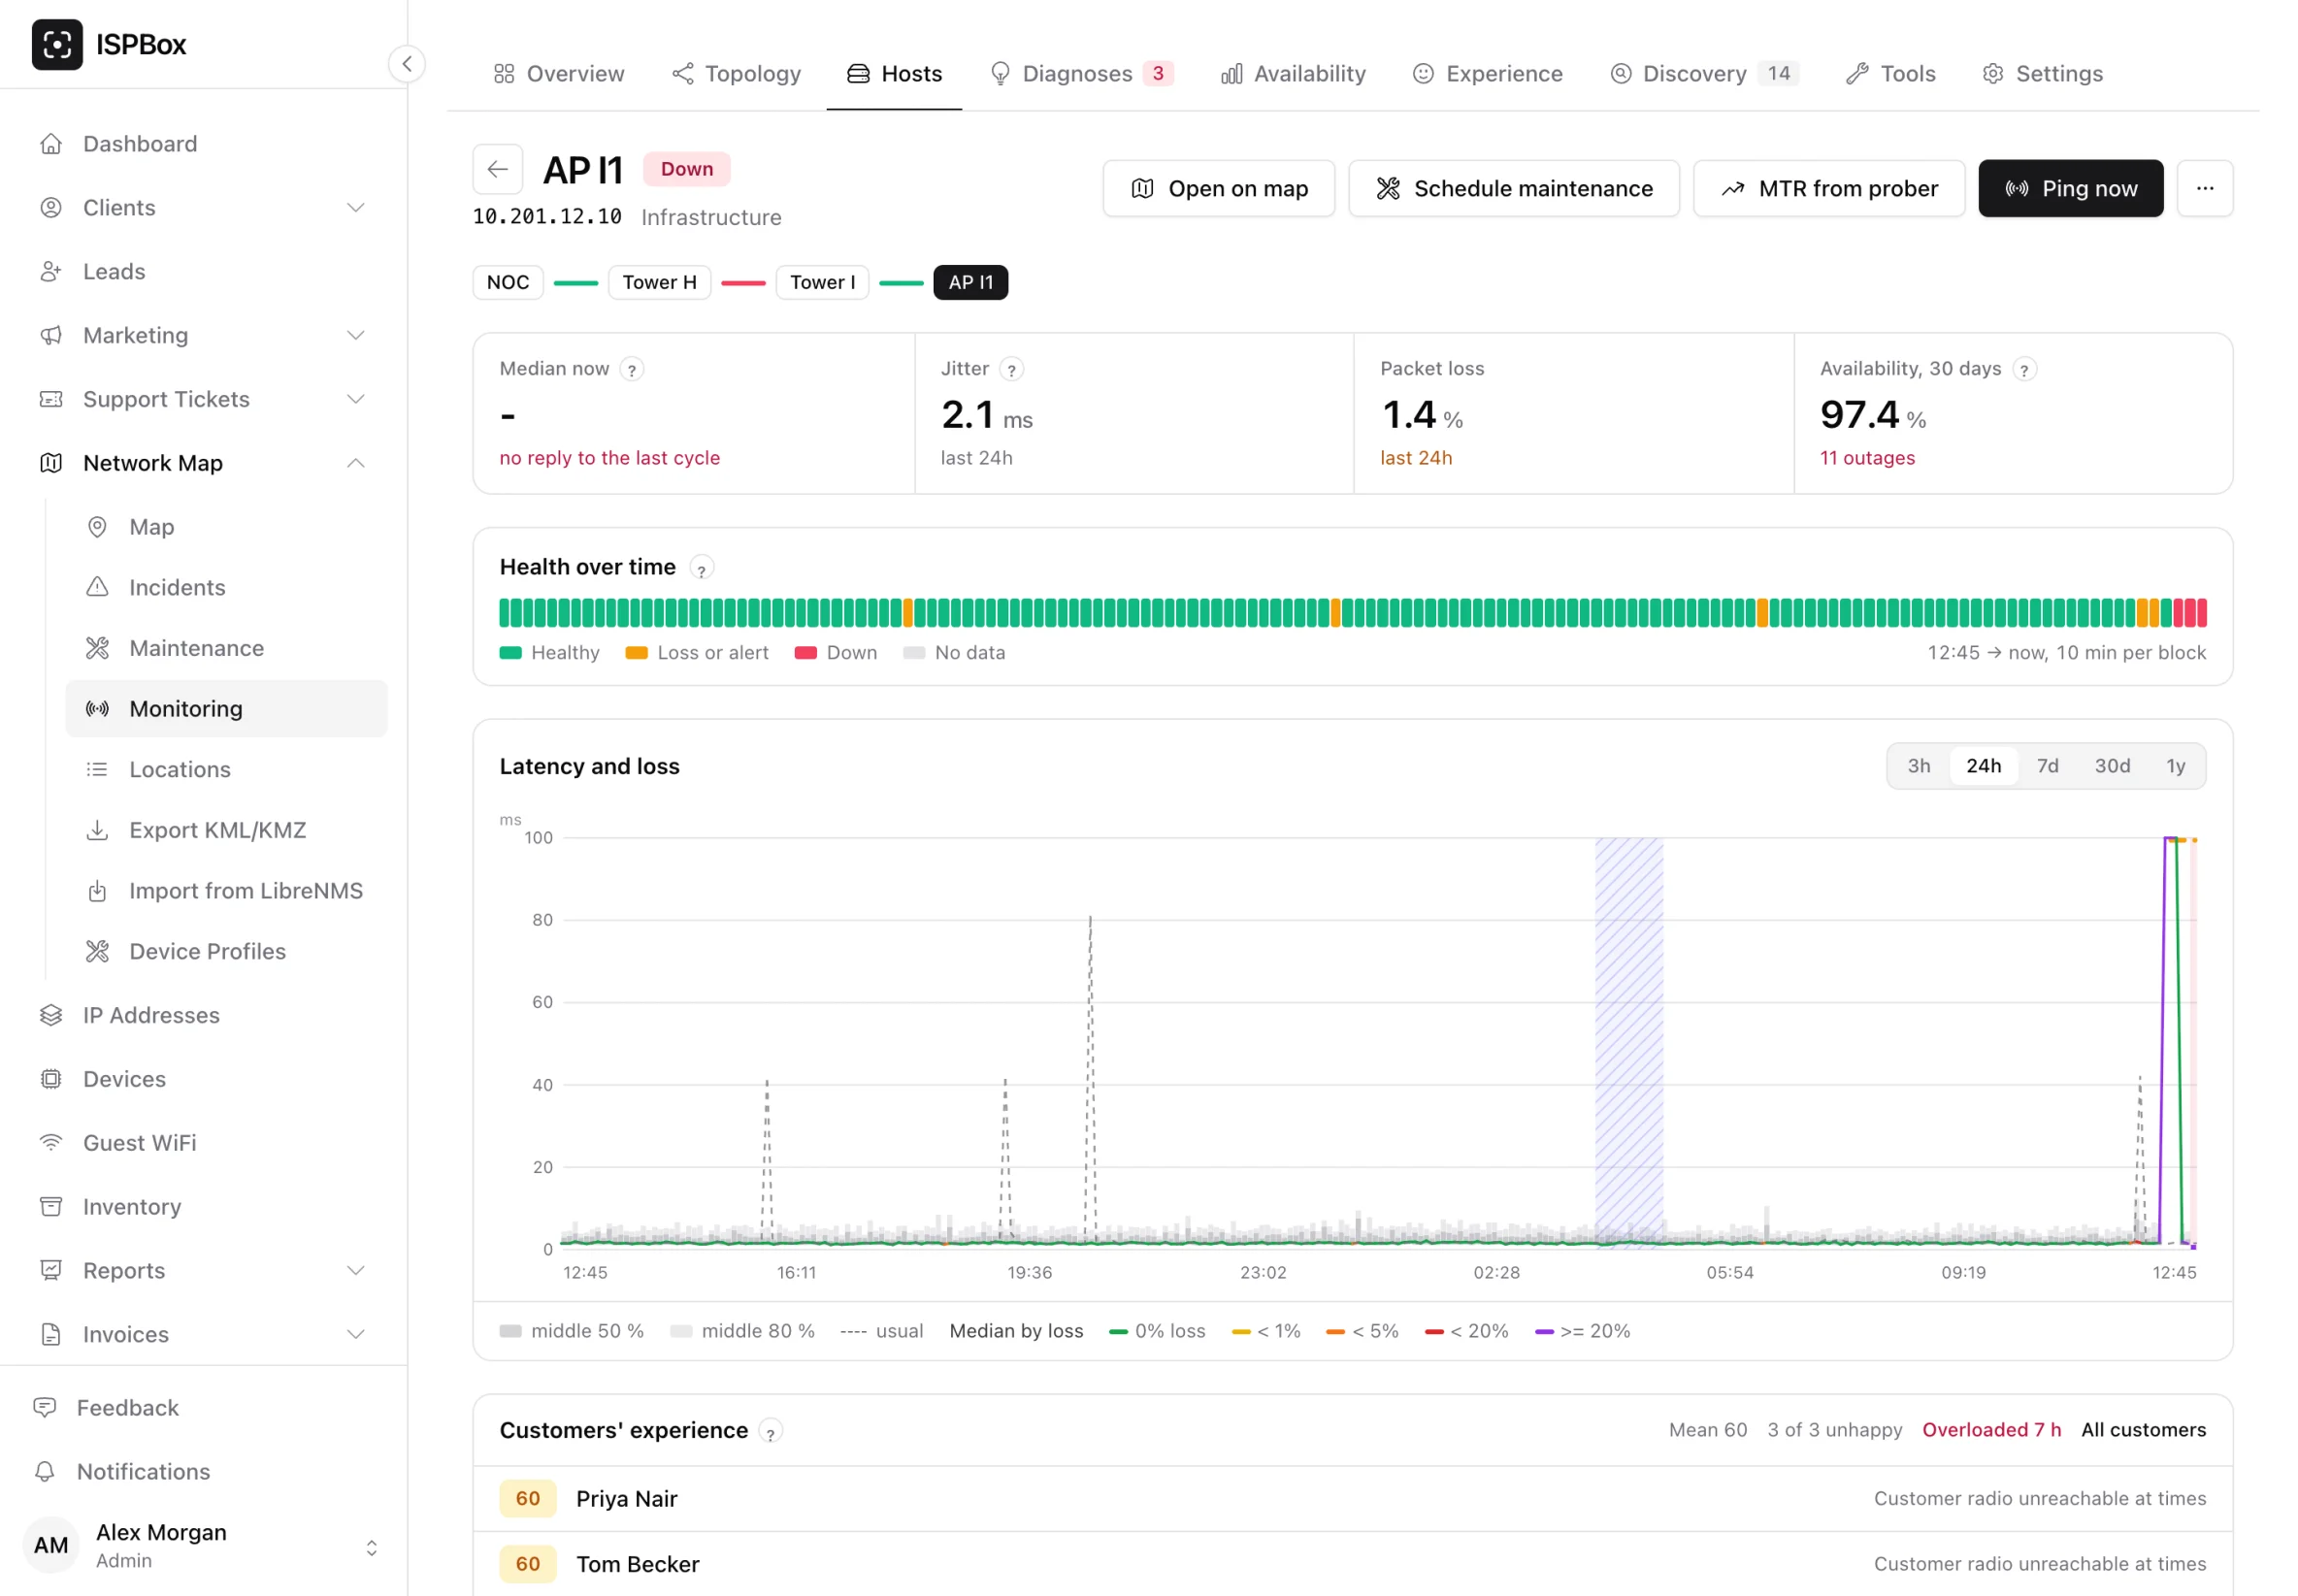
The probe only ever measures hosts. It pings a tower, an access point, a router, a customer's radio, and it records how many packets came back and how long they took. It never measures a link - a wireless hop or a fibre run has no address to ping.
So everything the panel says about a link is a conclusion, drawn by comparing hosts. This article is about how that conclusion is reached, how sure the module is allowed to be about it, and what the diagnoses built on top of it mean.
Degraded, clean, and the gap between them
Each cycle, every target is compared against its own baseline - what that host normally does in that five-minute slot of the day, learned from the last seven days.
- Degraded: at least 2 % loss, or a median more than 1.5 times the baseline plus 15 ms.
- Clean: no loss at all, and a median within 1.25 times the baseline plus 10 ms.
- Anything in between is neutral and is ignored.
The gap is on purpose. If degraded and clean were the same threshold, a host drifting either side of it would flip a link's verdict every five minutes. A host with less than a day of history has no real baseline yet, is marked provisional, and is judged on loss alone until it has one.
How a link gets its verdict
For every link, the panel looks at the targets whose path crosses it:
- If any target behind it is clean, the link is clean. One working host on the far side is proof the link carries traffic.
- If every target behind it is degraded, and there is at least one clean target somewhere else in the network, the link is suspect.
- If nothing anywhere is clean, no link is blamed. The verdict is unknown and a separate alert fires instead, because "everything looks broken from here" is almost always the probe's own uplink rather than every link at once.
That last rule is the one that keeps the module honest. Without it, a broken NOC uplink would light up the whole map red.
Root collapse: one fault reads as one fault
A backhaul going down makes every link behind it look suspect too. So the panel walks each broken path outwards from the probe's anchor: the first suspect link it meets is the root, and every suspect link further down that path is marked as shadowed by it.
Only roots matter. Roots are what the "needs attention" list shows first, roots are what open incidents, and a shadowed link never opens an incident of its own. That is the difference between one alert saying "the backhaul to Eagle Knob is down" and forty alerts saying every radio behind it is unreachable.
Direct or inferred
Every link is measured one of two ways, and it is worth knowing which before you trust a number. A diagnosis says which under What we measured, and on a link page with only inferred cycles the Added latency figure reads needs both ends measured.
- Direct - both ends of the link are measured hosts, so the panel can subtract the near end from the far end. A direct link gets both an estimated loss and an added-latency figure: exactly how many milliseconds this one hop costs.
- Inferred - only one end is measured. The loss is then the smallest loss any target behind the link sees, because that is the most that can honestly be blamed on this hop, and there is no added-latency number at all.
The way to turn inferred links into direct ones is to give both endpoints a management IP on the map. That is usually the single highest-value thing you can do for the quality of the answers.
One probe sees one direction
A probe measures a round trip, so a link it sees from one side only cannot tell an inbound problem from an outbound one. The link page marks such a link one direction next to its two ends, and hovering it says "Measured from Main NOC only - add a prober at the far end to see the other direction". It means exactly that: put a second probe at the far end of an important backhaul and the link is measured from both sides.
With more than one probe, a device that one probe has lost is not shown as down while another probe still got replies from it in the last ten minutes. A probe cut off behind a broken tower loses everything upstream of the break, and that is the probe's path, not the devices.
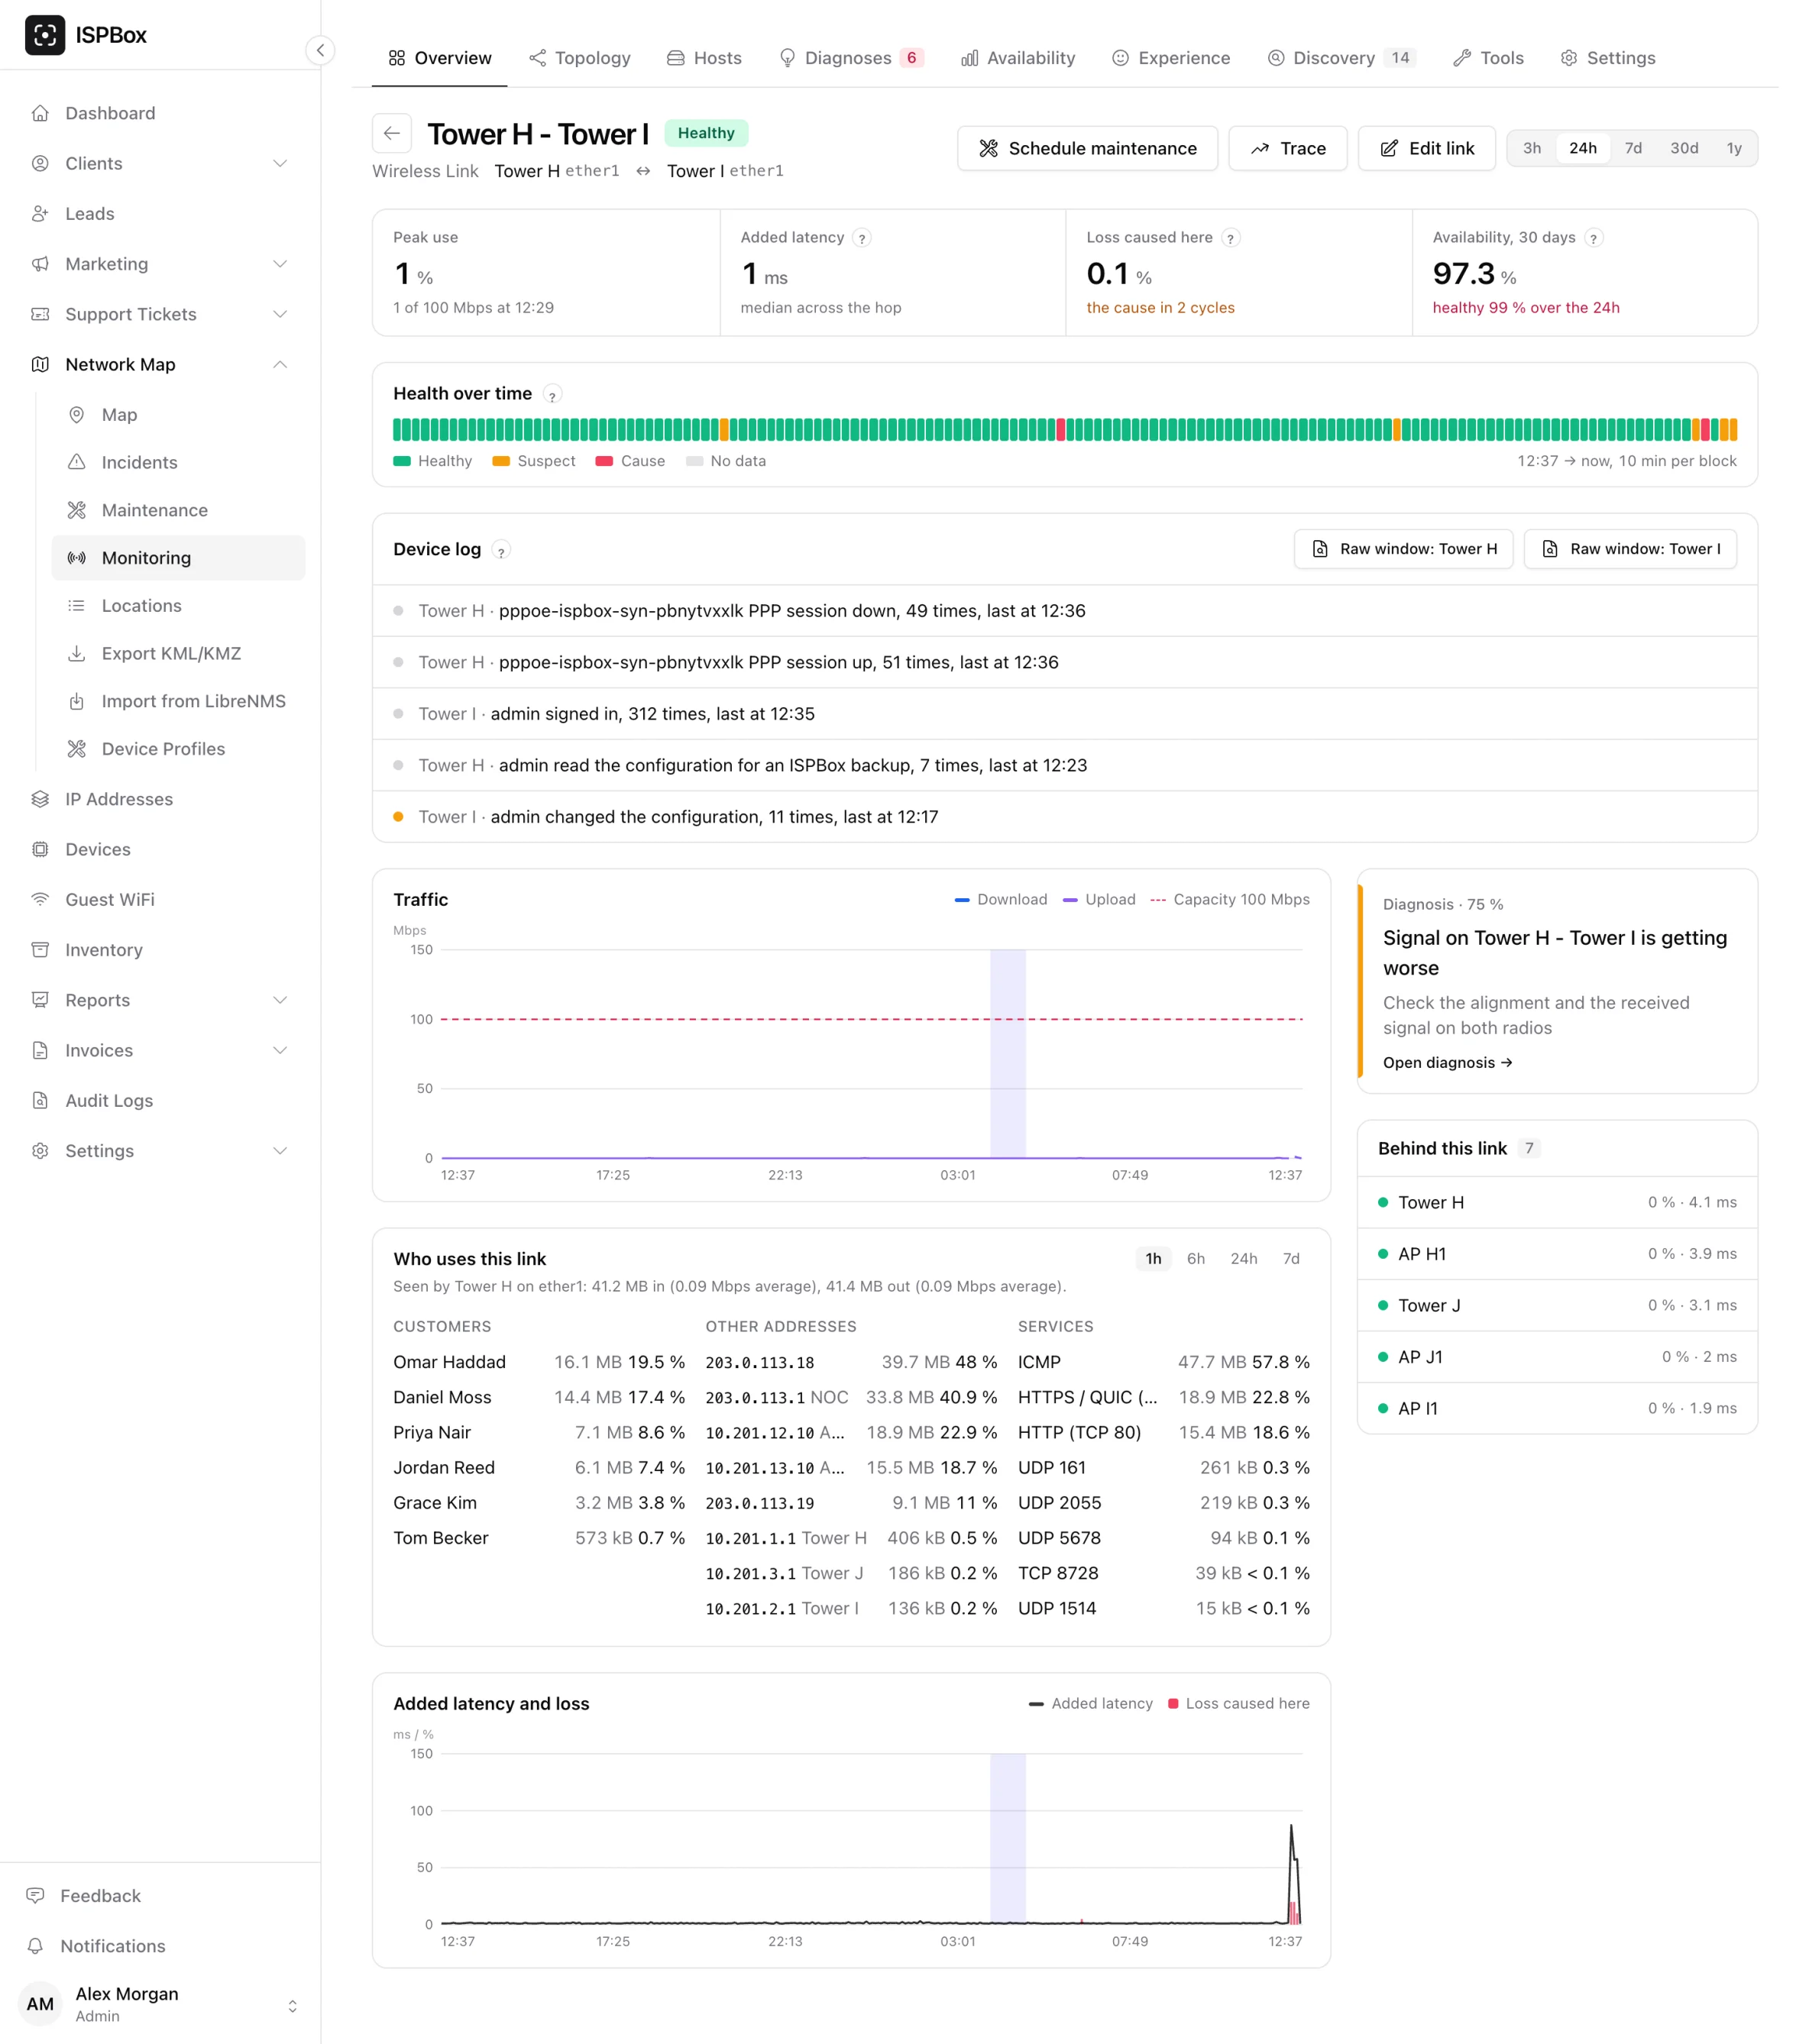
The link page also carries a Health over time strip: green for healthy, amber for suspect, red where this link was the cause, grey for no data. It shows how long the link has been like this and whether it is flapping or simply broken.
From verdicts to diagnoses
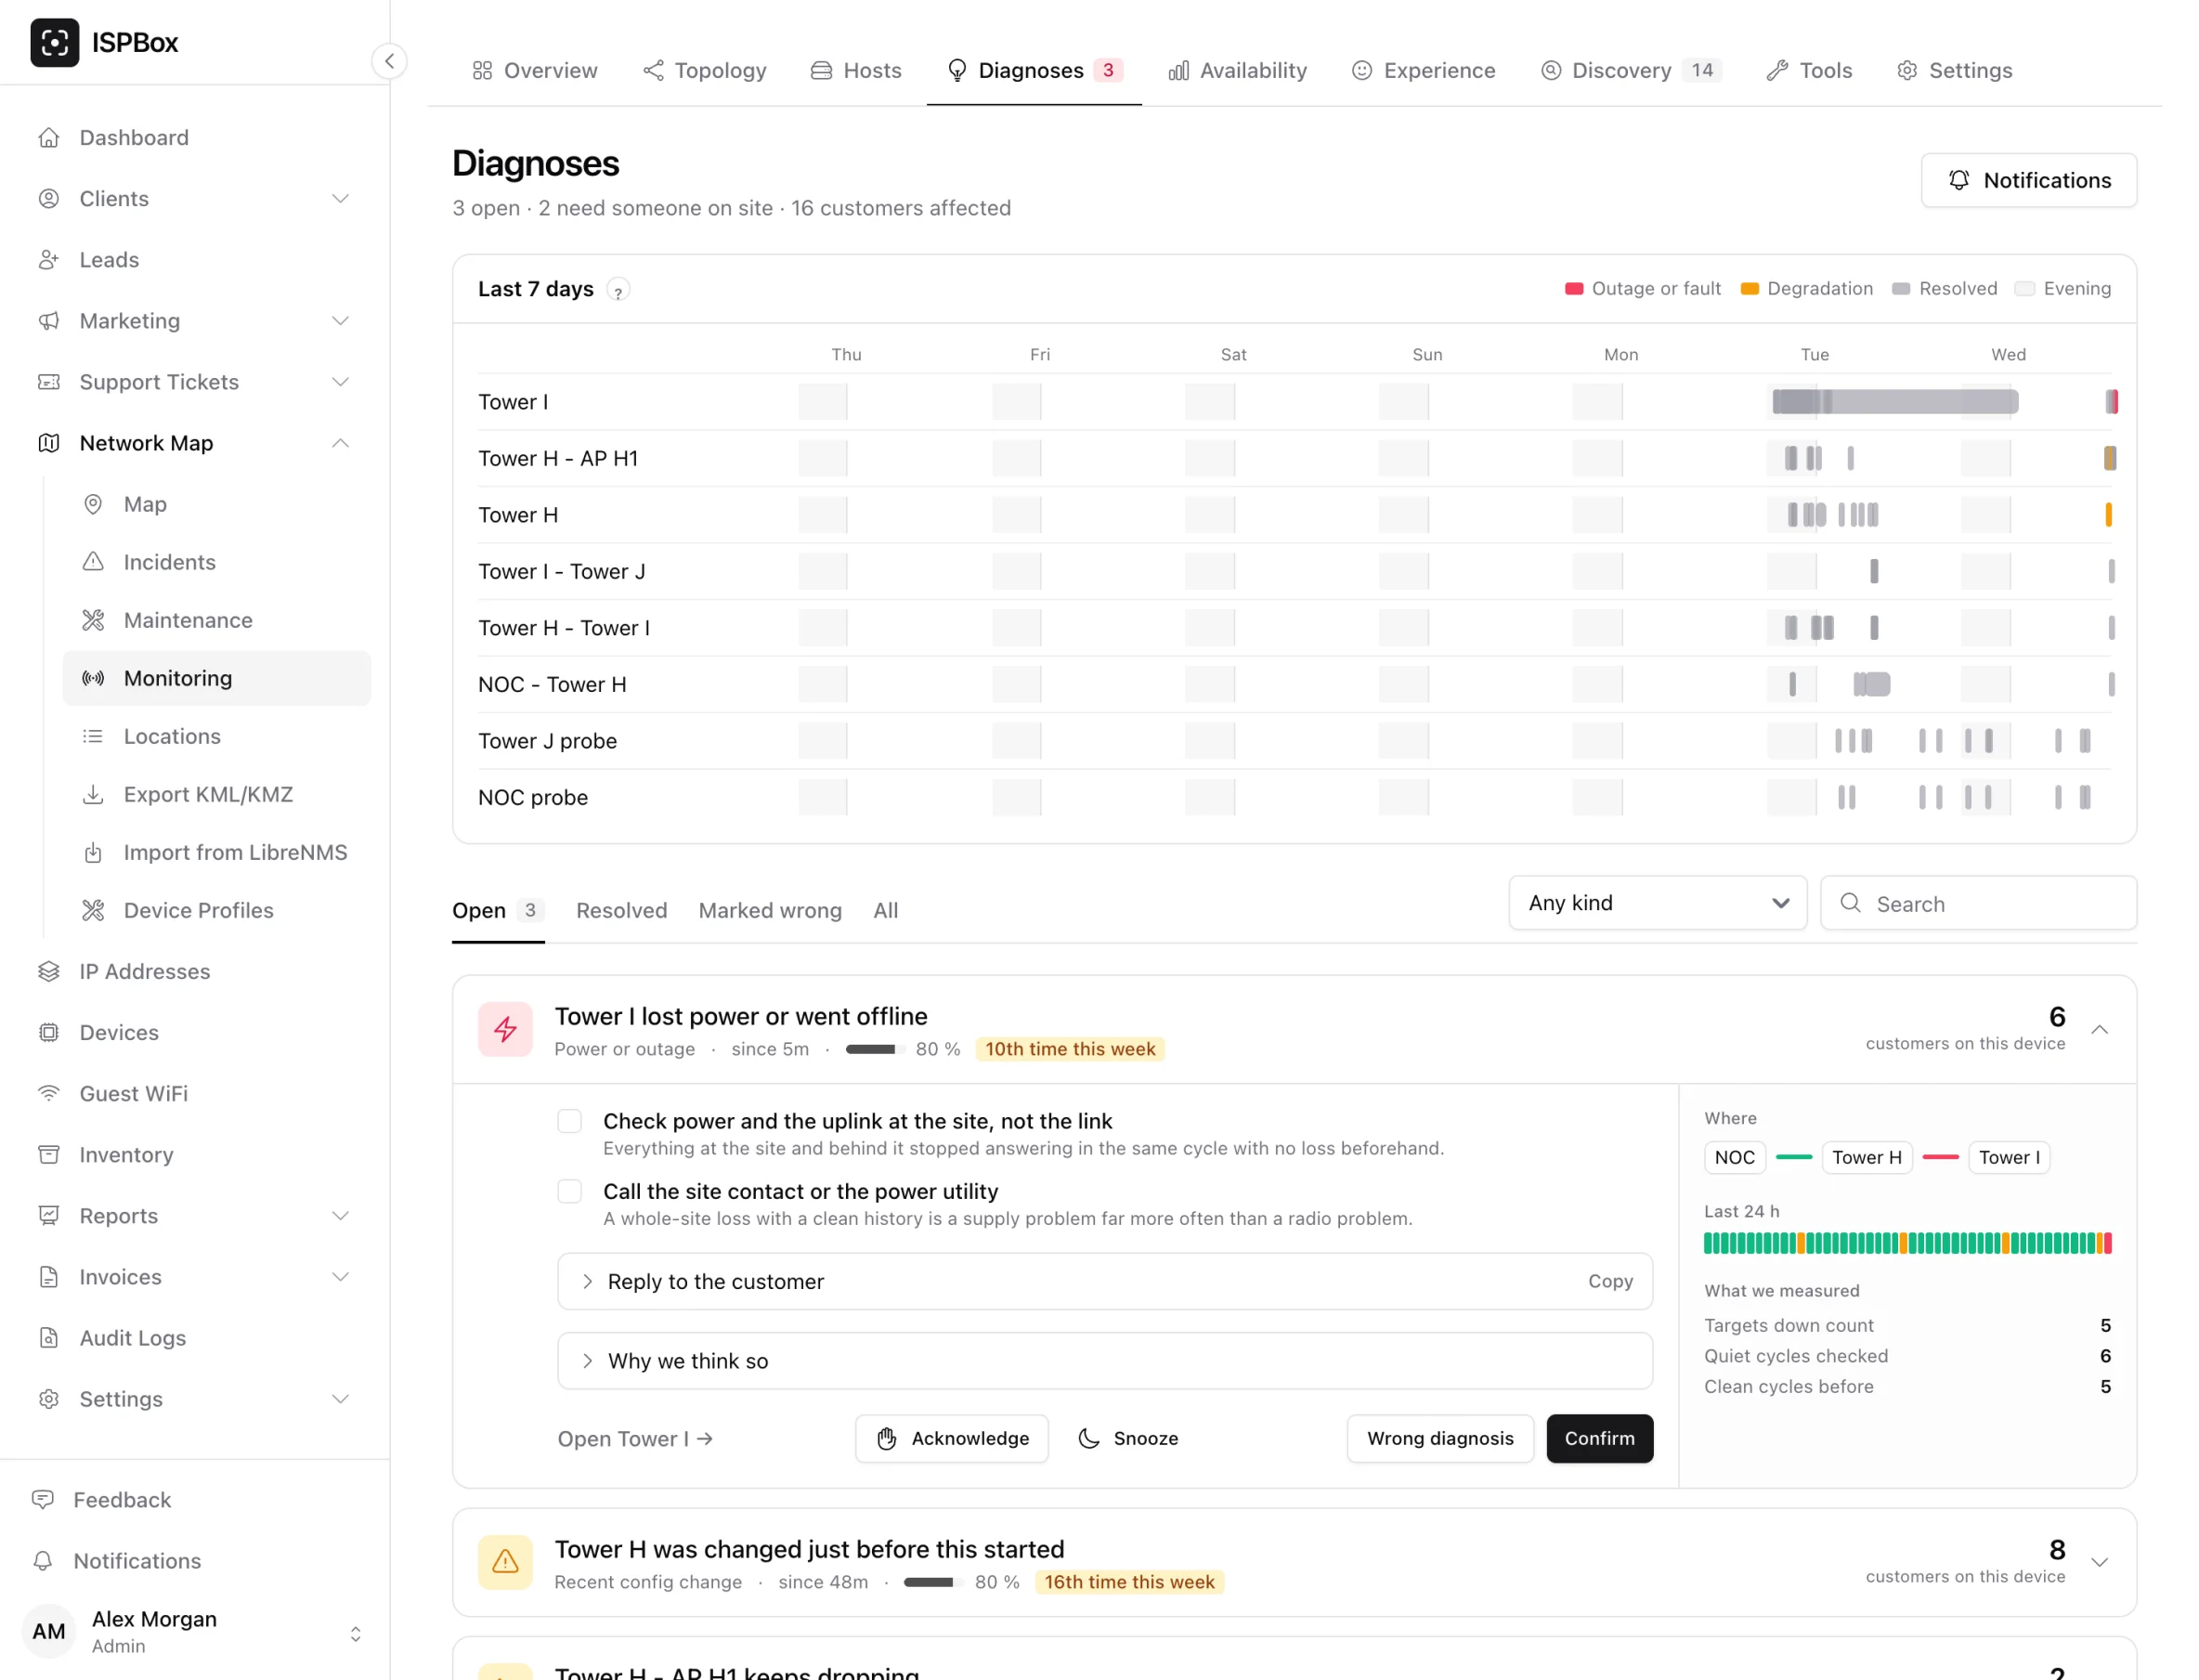
Attribution says which link is at fault. A diagnosis says what is wrong with it, how sure the module is, and what to do about it. They are listed under Network Map > Monitoring > Diagnoses. The whole list of things the module can conclude is fixed and written in code - twenty-one hypotheses, each with its own detector and its own arithmetic. Eleven of them reason from the measurements and are described below; the other ten read device logs, device health and the test customer login. No language model produces any of these numbers.
The eleven measurement diagnoses, in plain words
- Link fault - this link has been the root of a fault for at least two cycles. The plainest conclusion there is: something on this hop is broken.
- Saturation - the link has been running at 80 % of its capacity or more for three cycles in a row and it is now costing loss or latency. Not "it is busy" - busy is fine - but "it is busy and it is hurting". If there is a second link between the same two devices sitting idle, it is named in the suggested action.
- Radio degradation - a wireless hop whose added latency has roughly doubled against its own week-long baseline while its utilisation stayed low. Not traffic: alignment, interference, weather, or a radio on its way out.
- Power or outage - a whole site and everything behind it went dark in the same cycle, with a genuinely clean run before it. This one is deliberately hard to trigger: a single dark customer is not a site that lost power, and a gap in the samples is not a clean history.
- Customer side - one customer's connection is down or degraded while the access point serving them is up and at least 80 % of the other customers on it are fine. The fault is at the property. The recommended action says so, including "do not dispatch a tower visit".
- Plan saturation - a customer's connection looks bad, and they have been sitting at 90 % or more of the speed they bought for at least half of the last hour. Not a fault at all: an upsell conversation.
- Upstream ISP - at least half of the internet reference hosts are degraded while at least 90 % of your own infrastructure is clean, and the hourly traceroute shows where it starts going wrong. Nothing to fix internally, something to phone your transit provider about with a hop to quote.
- Capacity forecast - the weekly utilisation trend on a link reaches 80 % within eight weeks. A dated warning, so an upgrade can be planned rather than scrambled.
- Latency creep - a link or host whose latency has been climbing 30 % or more over four weeks with no saturation to explain it. Something to look at before it fails.
- Flapping - four or more up-and-down transitions in six hours. On this timescale that is usually a loose cable, a PoE injector or a power supply, not a radio.
- Blind prober - the probe itself cannot see anything clean, so its own uplink is the problem. This one explicitly says that the other diagnoses for that probe are paused, because nothing it reports right now can be trusted.
The other ten
- From the device logs: recent configuration change (a fault that started shortly after someone changed or upgraded the device), device overload (out of memory, CPU or disk), device unstable (three or more restarts in a day), DHCP pool exhausted and login attack (ten failed logins in ten minutes, or an account locked out).
- From device health over SNMP: overheating, unstable power and optic losing light.
- From the test customer login: authentication path broken and access service down.
Confidence, and why it is a number you can argue with
Every diagnosis carries a confidence from 0 to 100, worked out by fixed arithmetic, and the terms that went into it are stored with the diagnosis. A link fault starts at 60, gains 10 for each extra cycle it has been the root and 15 more if the link is measured directly, and is capped at 95. Nothing is ever 100: the module is reasoning from outside the device.
Open Why we think so on any diagnosis and you get the summary plus the evidence behind it - which targets were degraded, which were clean, the link health cycles, the context numbers. What we measured beside it shows the key figures. If you disagree with the conclusion, you can see exactly which piece of evidence to disagree with.
It is built to stay quiet
There is one open diagnosis per kind per subject. A second detection of the same thing bumps the "last seen" timestamp and merges the evidence rather than adding a row. A root link's fault supersedes the faults on the links it shadows. Evidence that has been gone for six cycles closes the diagnosis as resolved. And three suppressions run over every cycle: a dark site explains the link faults leading out from it, a customer at the ceiling of their plan explains their own connection, and a blind probe explains nothing at all.
Confirm, or mark as wrong
Every diagnosis has Confirm and Wrong diagnosis buttons, each with an optional note. Confirming records that the module was right. Wrong diagnosis records that it was not, and suppresses that hypothesis on that subject for seven days - so a conclusion you have already investigated and rejected stops coming back at you every cycle. Use the note: three months later it is the only thing that explains why.
The customer wording, and what it is not
Five of the eleven kinds - customer side, plan saturation, power or outage, link fault and upstream ISP - also carry a customer-safe version of the explanation. It uses the same projection as your public status page: an area label, never a device name, never an address, never anything about your topology.
Nothing is ever sent to a customer by the module. The customer wording is shown to staff as a suggested reply with a copy button, on the diagnosis and in the sidebar of a ticket from an affected customer. Somebody reads it, decides whether it is true and whether it is the right thing to say, and sends it themselves - or does not.
When a language model is involved, and what it may say
Optionally, a language model rewrites the staff summary, the customer reply and a ranking note when several diagnoses share a subject. It never discovers anything and it never produces a number: every figure it is allowed to use was computed by a detector first.
It is off unless the platform has been given a key, and the templated summaries are written to the row before the job ever runs, so the feed is never empty and never waits. The guardrails are enforced in code rather than only asked for in the prompt: a sentence naming an id or a name that was not in the evidence is deleted; a sentence quoting loss, added latency or utilisation without saying whether it was measured directly or inferred, and whether a capacity was declared or read off a port, gets that label appended; a sentence telling somebody to set, configure, reboot, flash or ssh into anything is deleted outright; summaries are capped at 120 words; and a customer reply that names any device, link, probe or host, or anything shaped like an address, is thrown away whole and the template stands instead.