Availability Reports
Uptime per device, link, site and customer from the measurements the monitoring already takes, the outages with their times, a monthly email and an SLA PDF for business customers.
"How reliable is your network?" deserves a number, and so does "how reliable was my connection last month?". The availability report gives both, from the same measurements the monitoring already takes: uptime per device, link, site and customer, the outages with their times, and a PDF you can hand to a business customer with an SLA.
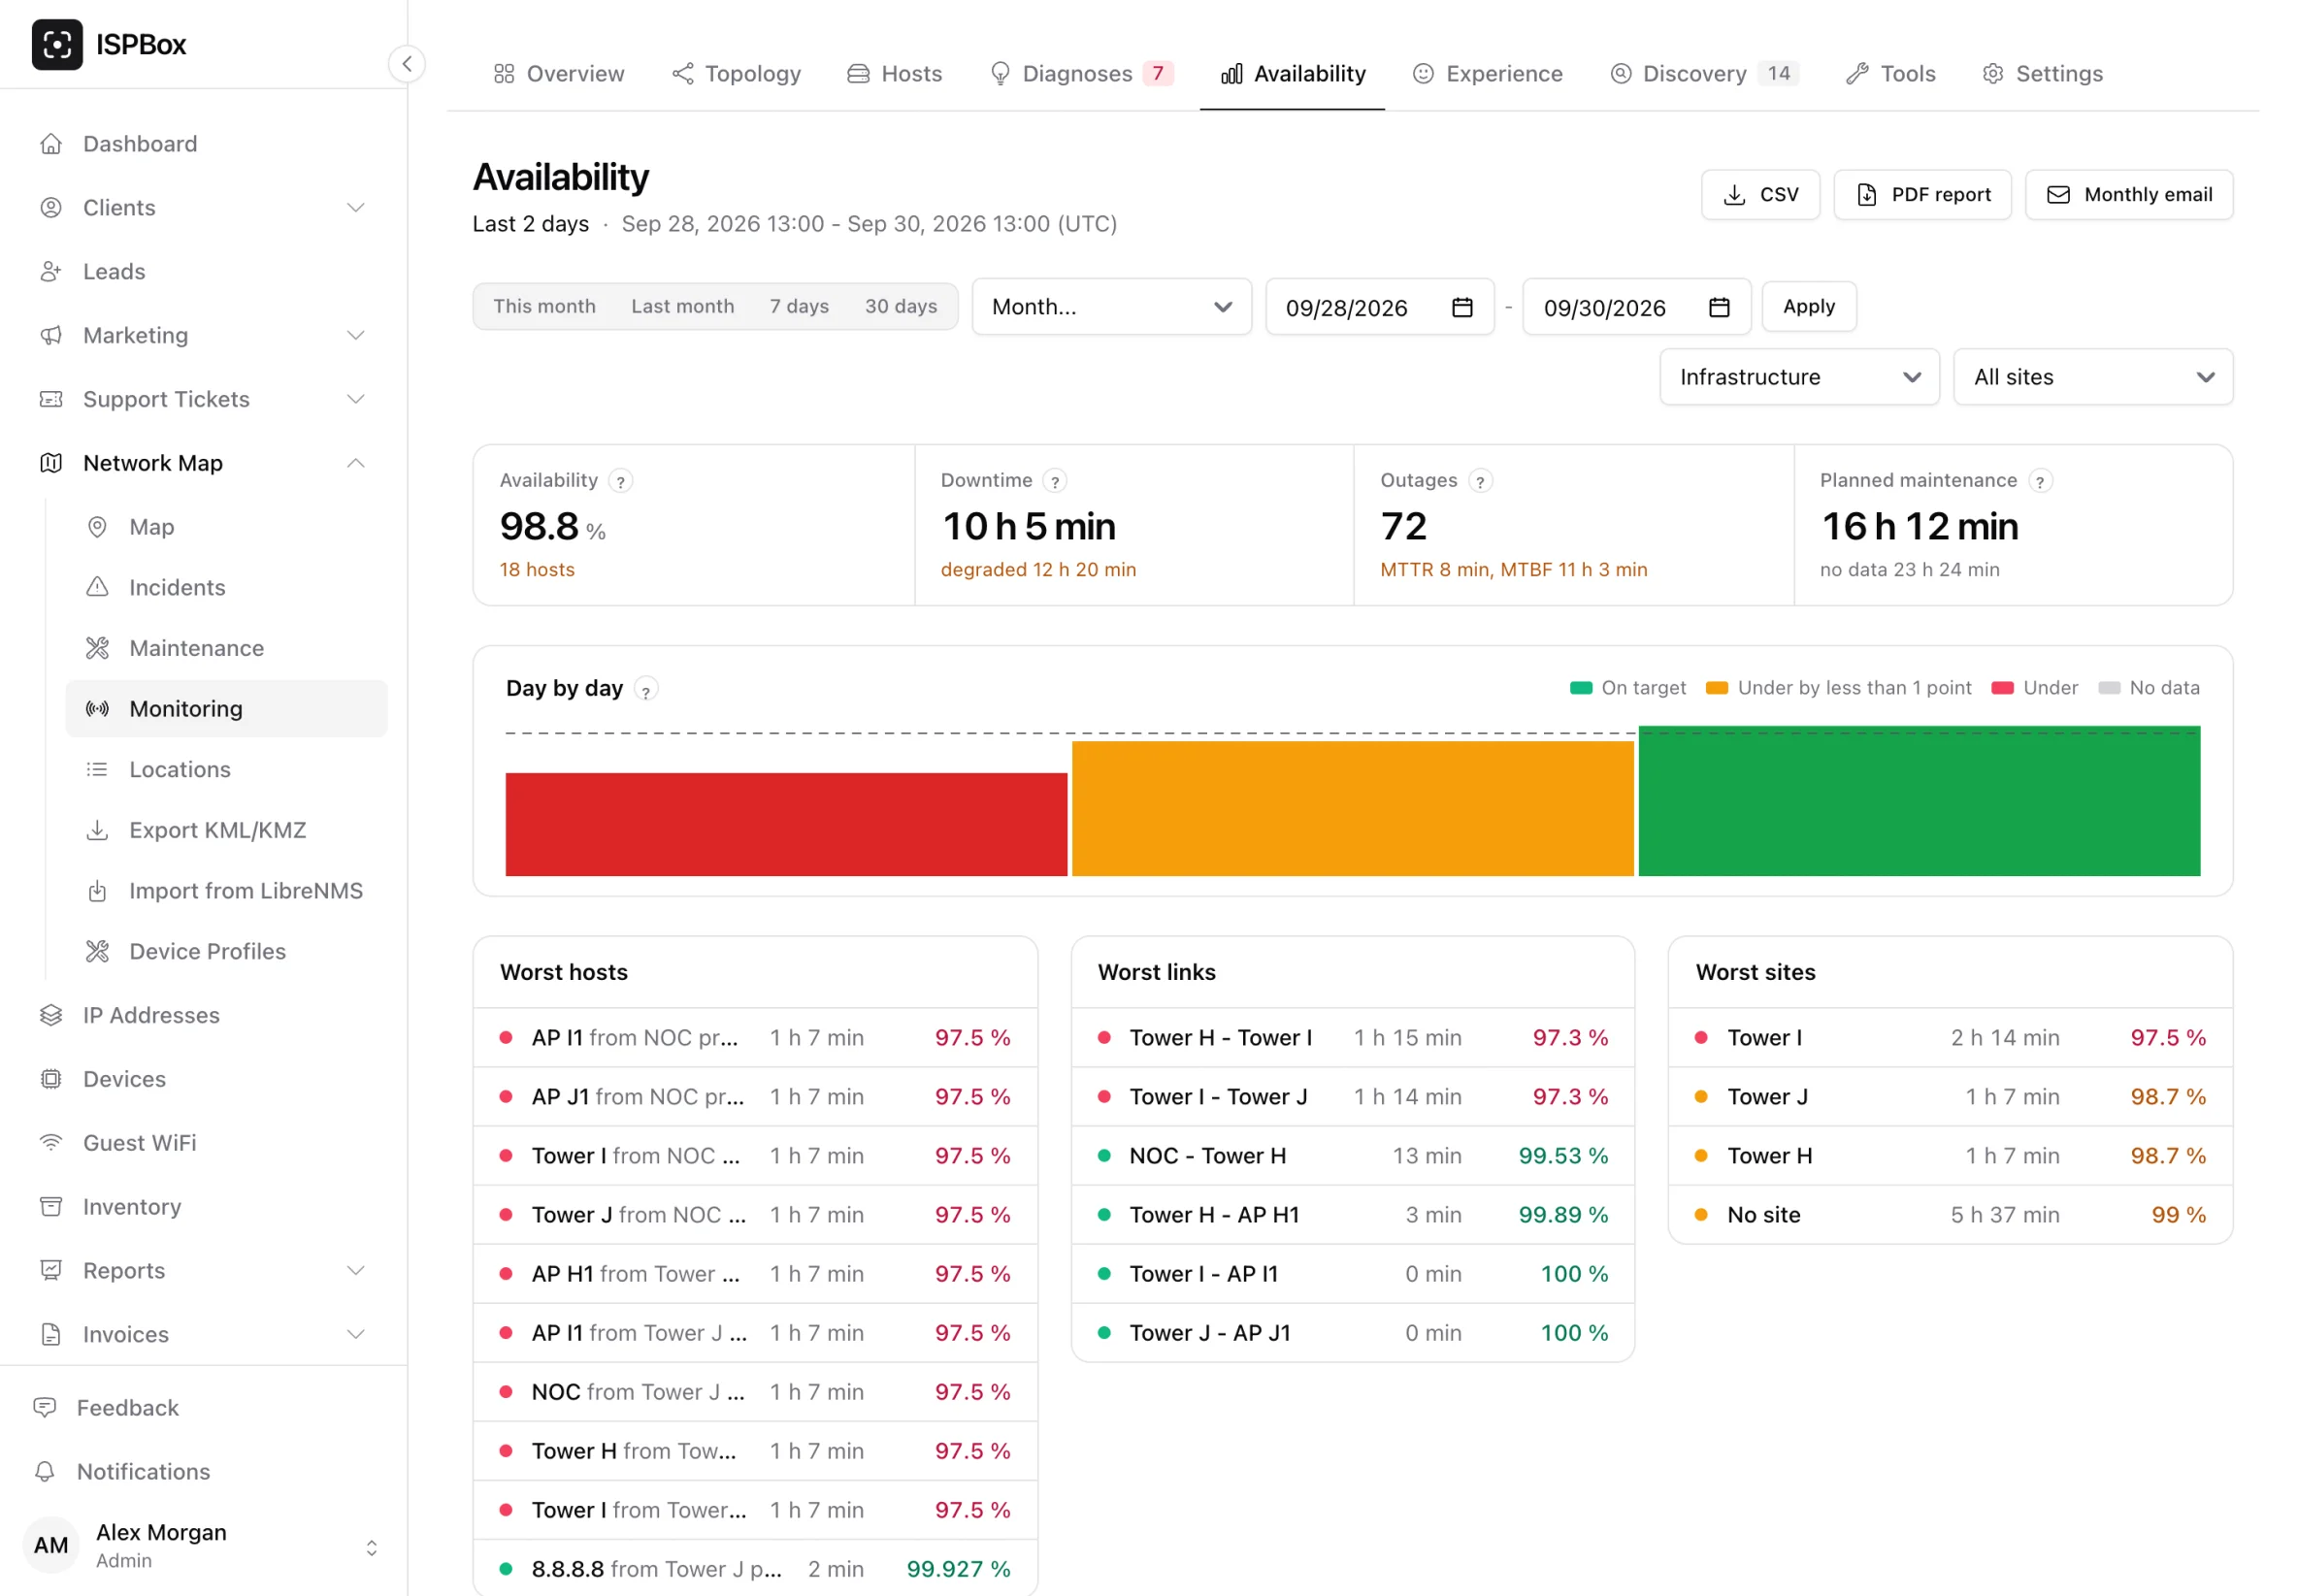
Open Network Map > Monitoring > Availability (it is also under Reports).
The report
Pick the period: this month, last month, the last 7 or 30 days, any month of the last year, or a custom range of up to 400 days. Months follow your workspace's own calendar and time zone.
- Four figures: availability, downtime (with how much of the rest was degraded, meaning the host answered but lost 10 % of its packets or more), the number of outages with the average time to fix (MTTR) and time between failures (MTBF), and the planned maintenance and no-data time that was left out.
- A day by day chart against your target.
- The worst hosts, links and sites, the outages, and the worst hours of the day.
- A table of hosts, links, sites, probes and SLA customers, sortable, each with a CSV download.
By default the report covers your infrastructure. Switch to customer radios or all hosts, or narrow it to one site.
What counts as down, and what does not
The report is built to be fair, so you can show it to a customer without footnotes:
- Planned maintenance is left out of the calculation entirely. Work you announced is not downtime.
- Time nobody could see is "no data", never downtime. If a probe was offline, or its own uplink was down so it could not reach anything, those minutes are not charged to the devices behind it.
- A link is only charged when it was the cause. When a tower loses power, the link into it is not also counted as failed for the same minutes.
One device, link or customer
Click any row, or use the availability figure on a host page, link page or the client page, to see one subject's report: its figures, the chart, every outage with start and end, the worst hours, and which planned work was left out.
SLA targets
Give a package an SLA target (for example 99.9 %) in Settings > Packages, or set one on a single service from its availability report. The report then says met or missed, and the SLA customers tab lists every active service with a target, worst first against its own target.
PDFs and the monthly email
Two PDFs carry your workspace's name, logo and colour:
- The network report for the period and filter on screen (PDF report), for your own records or your investors.
- The SLA report for one customer, in the customer's language. It names no device, site or address: only their service, its availability against the target, every interruption with its times, and the planned maintenance.
Monthly email on the Availability page sends last month's network PDF to up to ten addresses on the morning of the 1st of every month, in your workspace's time zone. Per service you can also switch on a monthly SLA email to the customer themselves, off by default. Each goes out exactly once per month.
Good to know
- Anyone who can see the network map can read the report; the SLA customers tab and the SLA PDF also need permission to see clients; the monthly email needs the settings permission; a service's SLA target and its SLA email need permission to manage services.
- Every PDF download is in the audit log.
- The same figures are in the REST API and the MCP server, as aggregates only.