Install the Network Probe
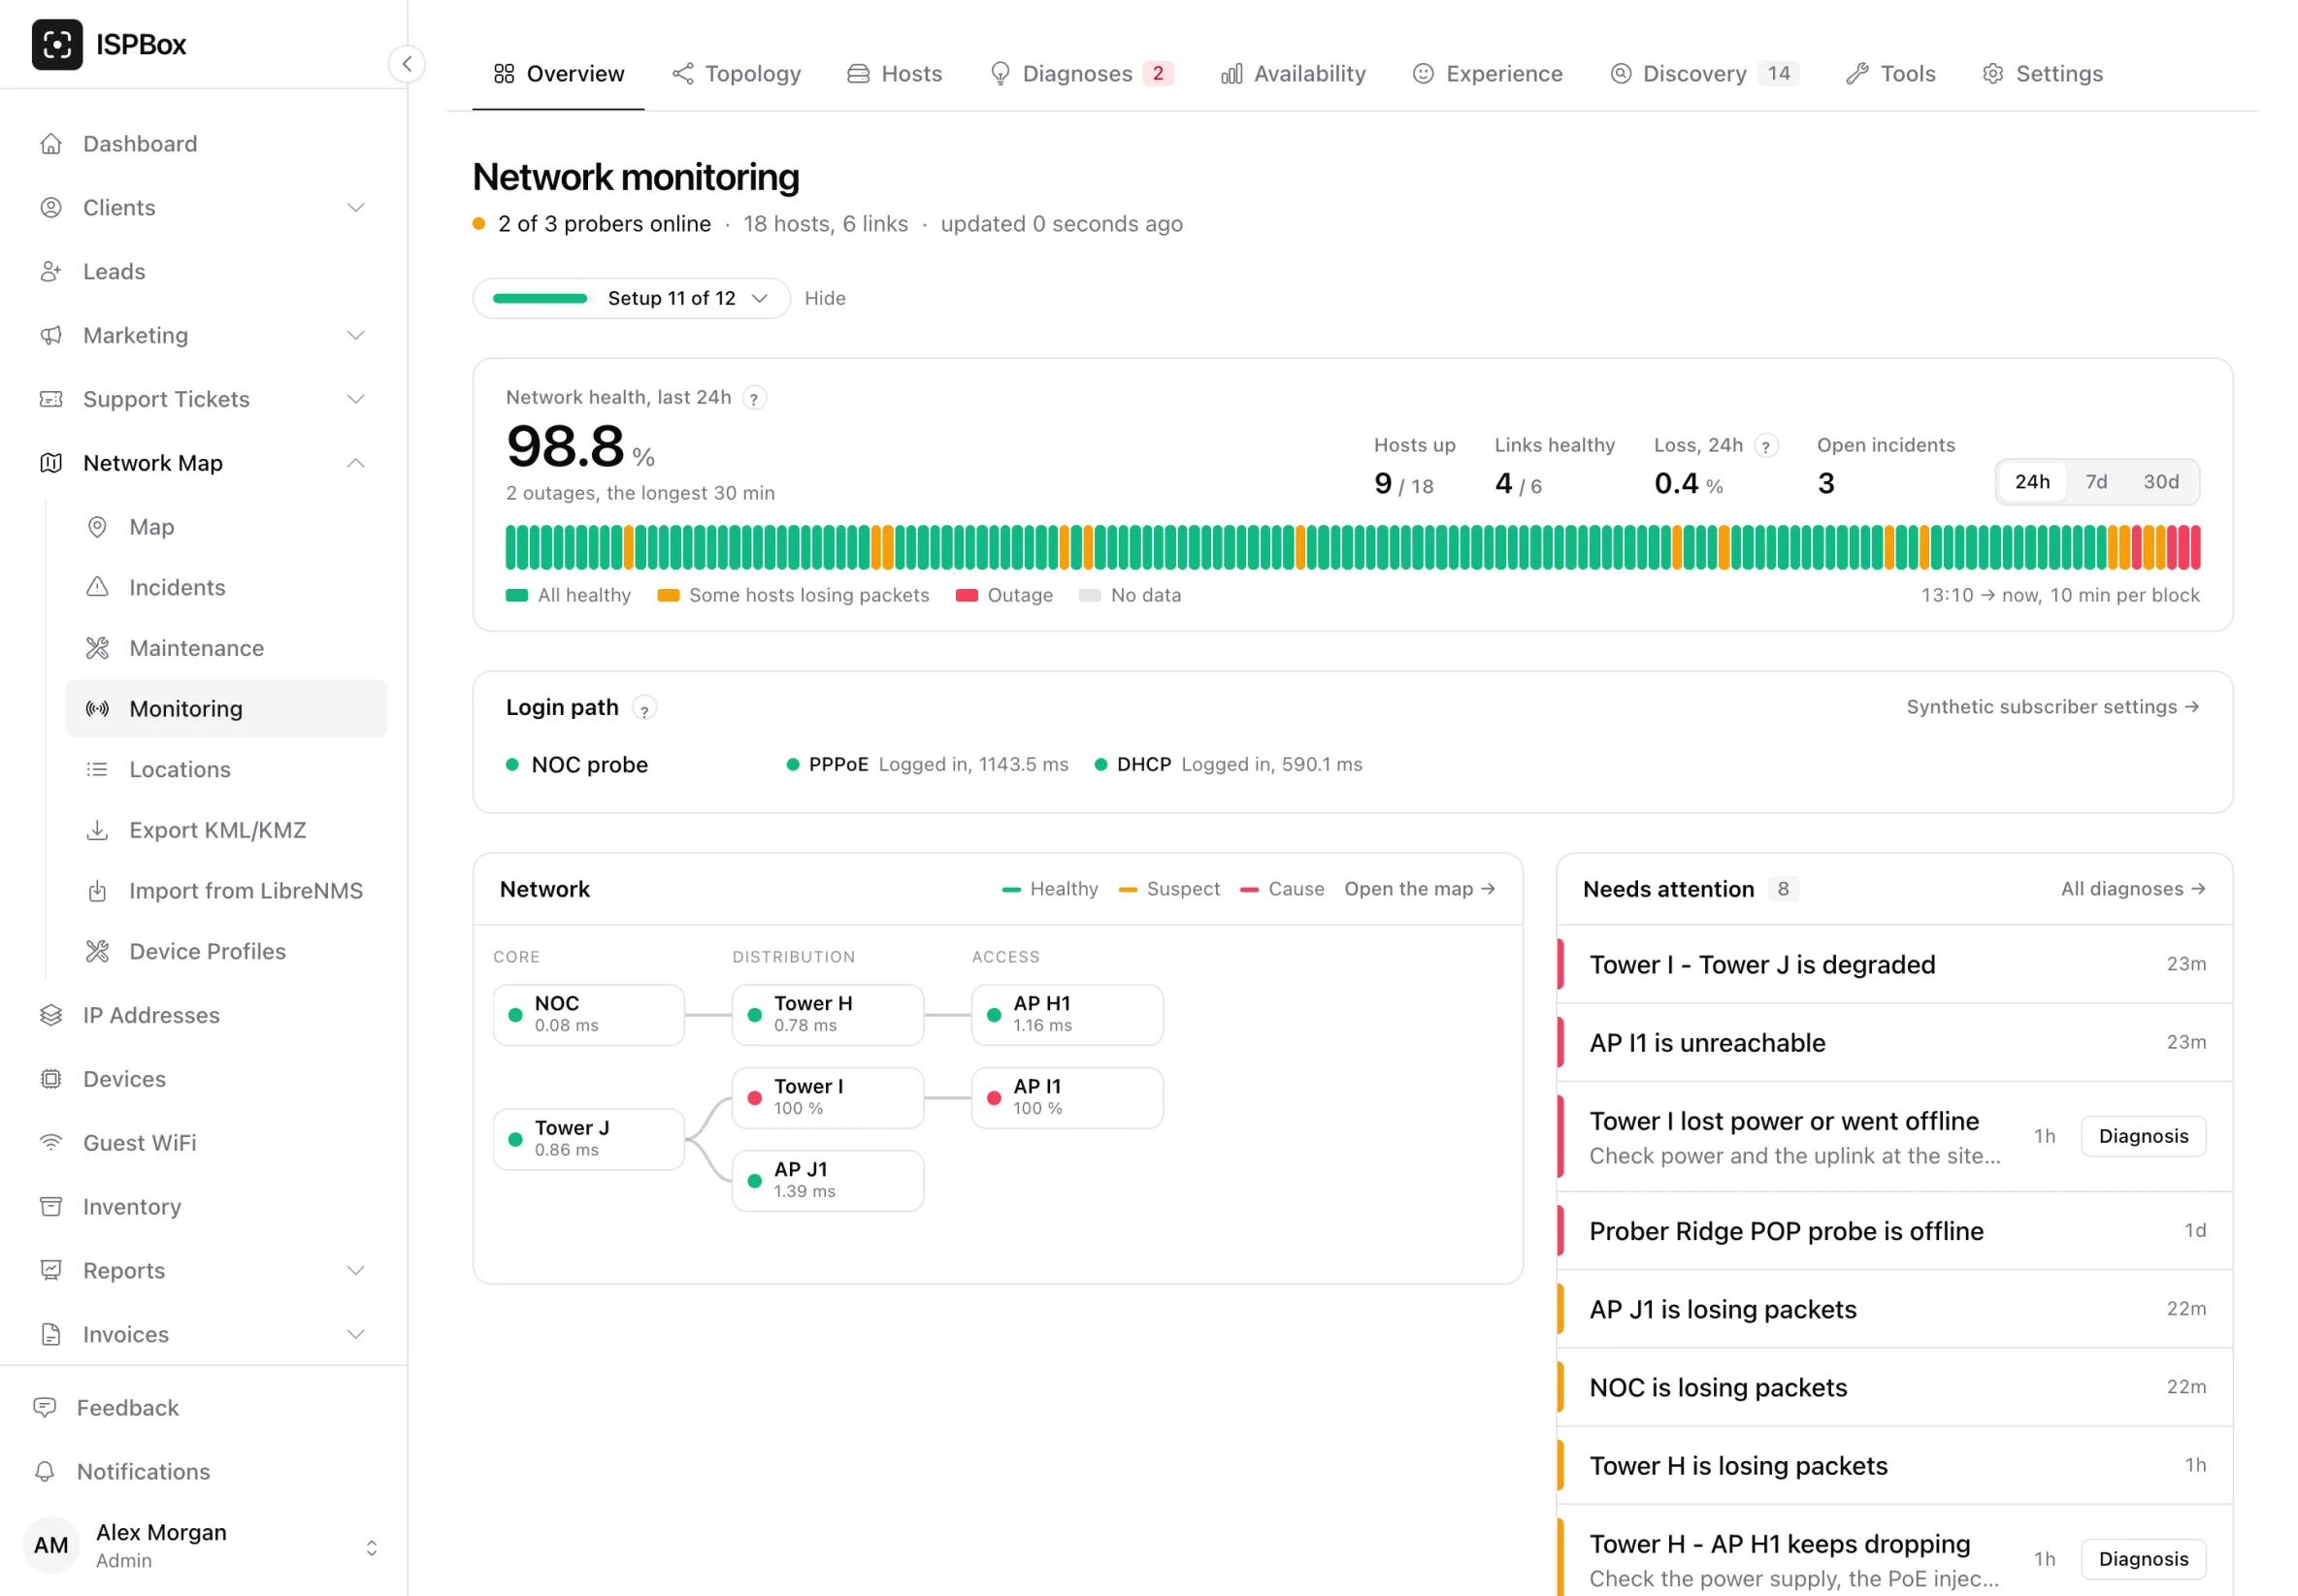
The network probe is one small container that measures loss and latency to everything on your map. Install it on a server with docker run, or inside a RouterOS 7 container on the MikroTik itself.
Network monitoring measures loss and latency to every device on your network map from inside your own network. The thing that does the measuring is a small program called the probe - the panel calls each running copy of it a prober. It is one container, about 8 MB to download and 18 MB unpacked, and it runs either on a server at your NOC or inside a RouterOS 7 container on the MikroTik itself.
You need at least one. Until a probe is running and anchored to a point on your map, the monitoring pages have nothing to show.
Before you start
- Draw the map first. Targets are built from your network map, not typed in twice. A point feature needs a management IP for the probe to measure it, and the lines between points are what lets the panel say which link is at fault. A map with devices but no lines gives you host charts and no link verdicts.
- Decide where it runs. A probe can only reach its own routing domain. If two parks both use 192.168.1.0/24, they need two probes, one on each side - which is exactly what the RouterOS container is for.
- Pick the anchor. Every probe is anchored to one point on the map: the device it runs on or next to. Paths are measured outwards from there, so the anchor decides what "upstream" means for everything that probe measures.
1. Create the probe in the panel
Go to Settings > Network monitoring > Probers and press Add prober. It takes four short steps.
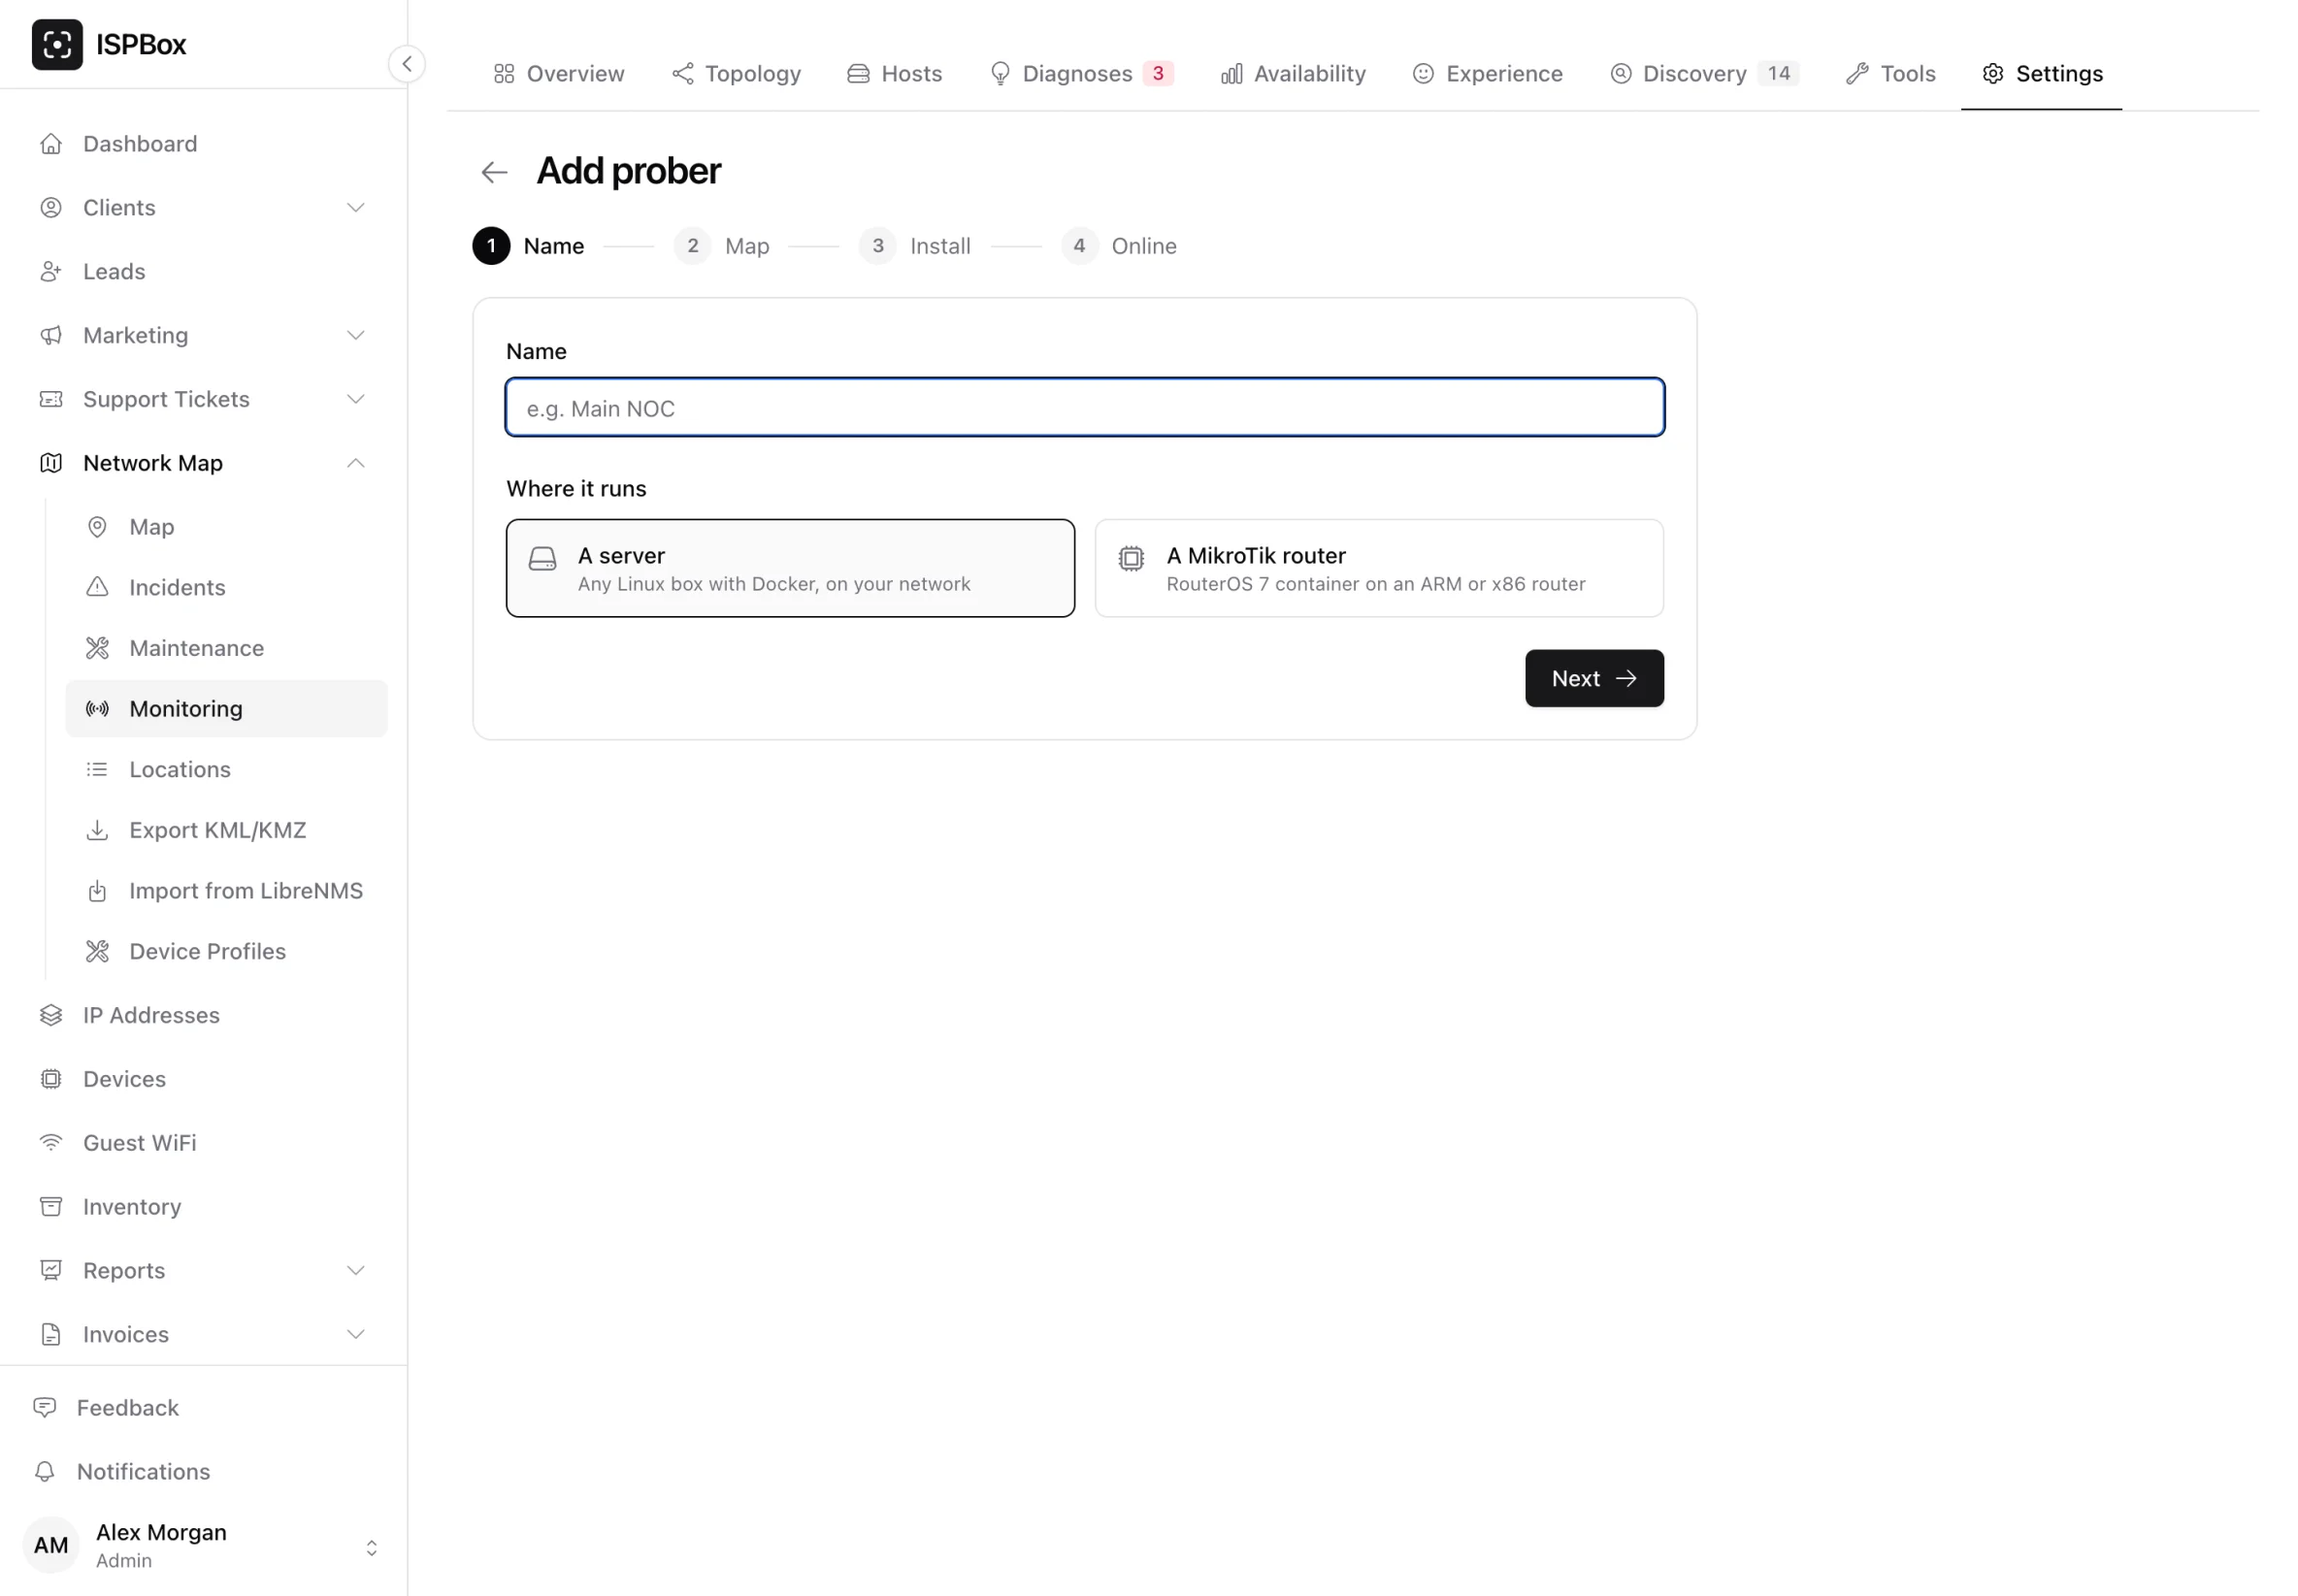
- Name - what you will recognise it by on the map and in alerts, for example "Main NOC" or "Eagle Knob tower", and where it runs: a server with Docker, or a MikroTik router with RouterOS 7.
- Map - the map point it plugs into, its anchor. Paths are measured outwards from there, so until it is placed nothing can be traced to a link. Skip for now places it later.
- Install - the command to run on the server, or the script to paste into the router terminal, with your own workspace address and the prober's key already in it. The key is shown only once: copy the command now. Only its hash is stored and it can never be read again; if you lose it, press Rotate key on the prober card and update the box.
- Online - the page waits for the first heartbeat and, if none comes within two minutes, lists what to check: that the box reaches your workspace over HTTPS (port 443 out), the clock on the box, the NET_RAW capability (or container device mode on a MikroTik), where the log says why, and the key. Issue a new key on this page replaces a lost or mistyped one.
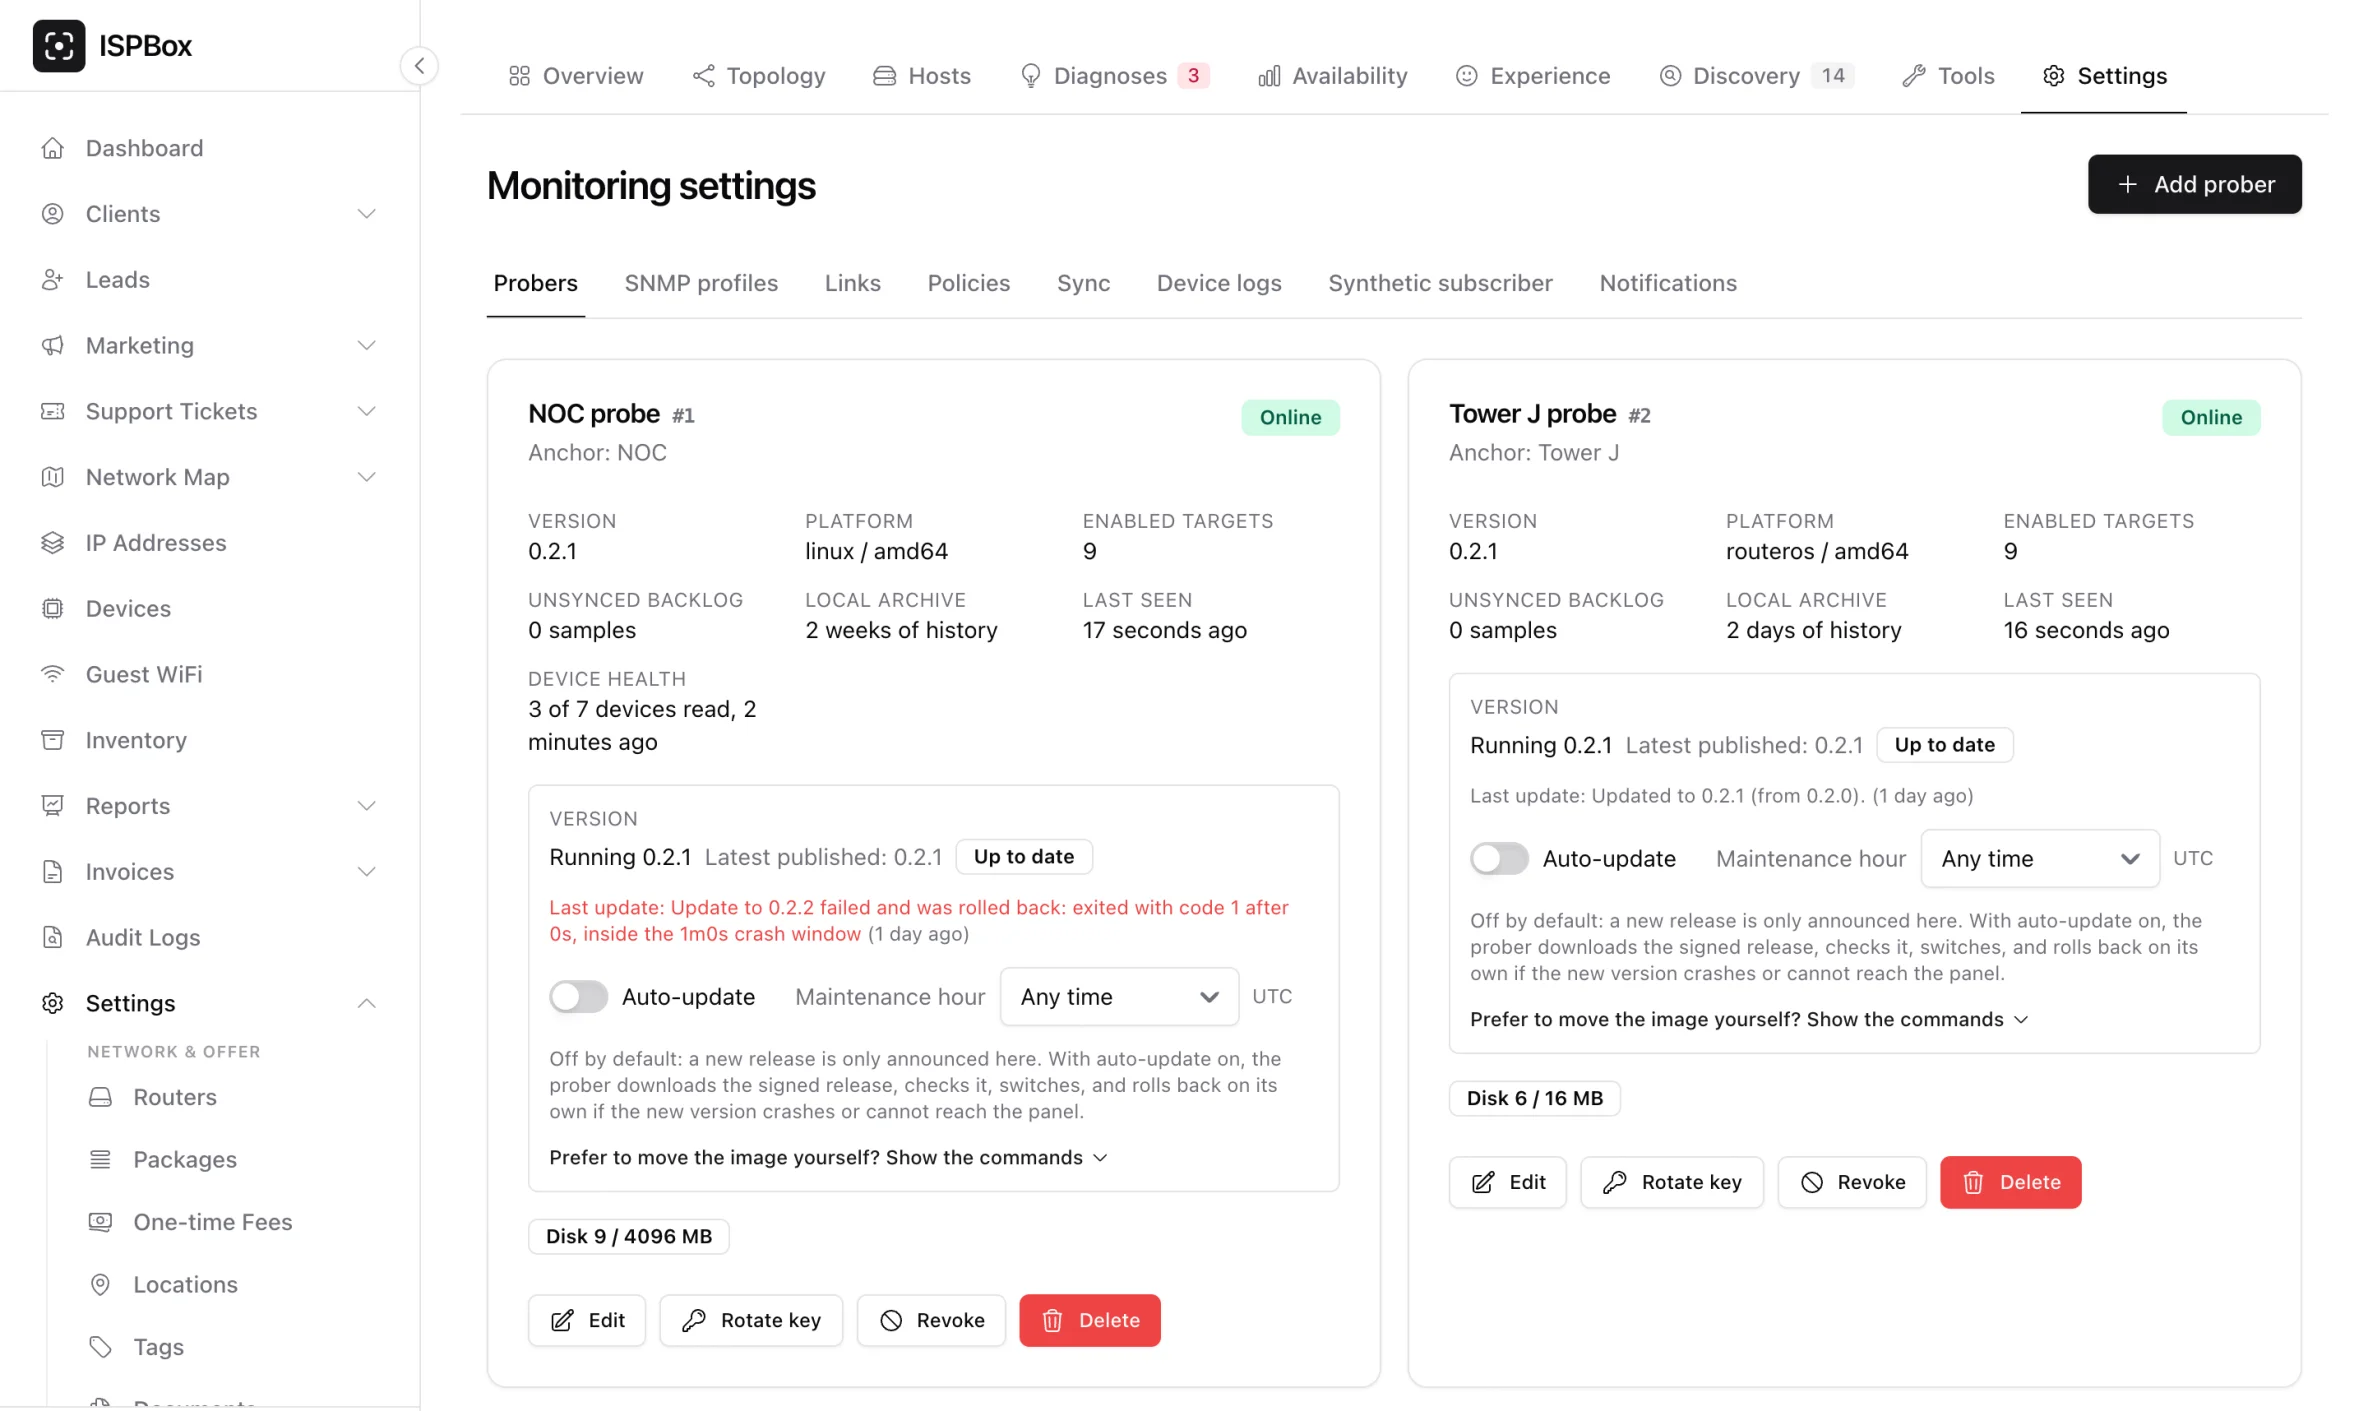
How the probe measures is set with Edit on its card:
- Anchor feature - the map point it plugs into, if you skipped it or the probe has moved.
- Cycle length (60-900 s, 300 by default), Packets per cycle (5-50, 20 by default), Packet interval (200-2000 ms, 1000 by default) and Timeout (500-5000 ms, 1500 by default). One cycle has to fit inside itself: packets times interval, plus the timeout, must not be longer than the cycle. The form refuses the combination if it does not.
- Poll interface counters over SNMP (with Read device and radio health under it), Collect traffic flows (NetFlow v5 / v9, IPFIX) and Discover neighbours and unknown hosts - all off by default, all described in their own articles (Device health, Traffic flows, Network discovery).
- Local retention and Local disk limit - how much history the probe keeps on its own disk. Leave them empty to use whatever is set on the box. The form tells you how many days the limit you typed holds for the number of targets this probe has.
- Target limit - a guard, 4000 by default and at most.
2. Run it on a server
Anything that runs Docker will do - the NOC server, a small VM, a Raspberry Pi at the tower. The image is multi-architecture, so the same tag works on x86, ARM64 and 32-bit ARM.
docker run -d --name ispbox-probe --restart unless-stopped \
  --cap-add NET_RAW \
  -v ispbox-probe:/data \
  -e ISPBOX_PANEL_URL=https://yourisp.ispbox.net \
  -e ISPBOX_API_KEY=ispb_probe_... \
registry.ispbox.net/ispbox-probe:latestISPBOX_PANEL_URLis your own workspace address. A custom domain works too - the Install step fills in whichever host you are looking at the panel on.--cap-add NET_RAWis what lets the probe open a raw socket for ICMP. Without it the probe still starts and still measures TCP, HTTP and DNS targets, and says so in the log.-v ispbox-probe:/datais the local archive. Do not skip it: without a volume the history is thrown away every time the container restarts.- Device logs and test customer logins need extra Docker flags (published syslog ports, the host network). Their own articles give them: Device logs and Test customer login.
If you prefer a file to environment variables, save this as /data/probe.yaml and keep it at mode 600, because it holds the key. The file wins over the environment when both are set.
panel_url: https://yourisp.ispbox.net
api_key: ispb_probe_...
data_dir: /data
local_retention_days: 90
disk_limit_mb: 4096
status_page: "127.0.0.1:8080"
log_level: info
A missing or unreadable address or key is a startup error with a sentence saying where to set it, not a silent retry loop. The address has to start with https://; the probe refuses to send its key over plain HTTP. The key is never written to the log.
3. Run it on a MikroTik
RouterOS 7 can run the same container, which is the answer to a park with its own private range. Two steps are not reversible from a chair, so read the whole section before touching a production router.
Somebody has to be at the site. Turning on container device mode needs a physical button press or a cold power cycle within about five minutes of the command.
/system/rebootdoes not count. Plan it for a visit that is happening anyway.
What the board needs
- A current RouterOS 7 release with the container package installed (it is an extra package, not in the default bundle - download the "Extra packages" archive for your version and your architecture, upload the
.npk, reboot). - Device mode with
container=yes. - Space. The image unpacks to about 18 MB and the archive grows with the number of targets: roughly 2.1 MB a day at 50 targets, 8.4 MB a day at 200. Budget the image plus at least 64 MB of writable space, and about 50 MB more for probe updates. Only the roomier boards (RB5009, CCR2004, hEX refresh class, anything with NVMe) have that on internal flash; on everything else use USB, microSD or NVMe.
- About 40 MB of free RAM.
The script
Device mode, then storage, then a network for the container, then the registry, then the container itself. Replace usb1 with your own disk slot and pick a container subnet that does not collide with anything the router already routes. The commands use the syntax of RouterOS 7.23 and later (list=, envlists=, mountlists=, memory-high=); on an older 7.x release, upgrade RouterOS first. The Install step of Add prober gives you everything from the network part down, with your address and key already filled in.
/system/device-mode/update container=yes
# press the reset / mode button, or cold power cycle, within ~5 minutes

/disk/format-drive usb1 file-system=ext4 label=containers

/interface/veth/add name=veth-probe address=172.20.0.2/24 gateway=172.20.0.1
/interface/bridge/add name=containers
/interface/bridge/port/add bridge=containers interface=veth-probe
/ip/address/add address=172.20.0.1/24 interface=containers
/ip/firewall/nat/add chain=srcnat action=masquerade src-address=172.20.0.0/24 \
    comment="ispbox-probe egress"
/ip/dns/set allow-remote-requests=yes

/container/config/set registry-url=https://registry.ispbox.net tmpdir=usb1/pull memory-high=200MiB

/container/envs/add list=ispbox key=ISPBOX_PANEL_URL value=https://yourisp.ispbox.net
/container/envs/add list=ispbox key=ISPBOX_API_KEY value=ispb_probe_PASTE_THE_KEY
/container/envs/add list=ispbox key=ISPBOX_DATA_DIR value=/data
/container/envs/add list=ispbox key=ISPBOX_LOCAL_RETENTION_DAYS value=auto
/container/envs/add list=ispbox key=ISPBOX_DISK_LIMIT_MB value=64
/container/envs/add list=ispbox key=ISPBOX_STATUS_PAGE value=0.0.0.0:8080
/container/envs/add list=ispbox key=ISPBOX_PLATFORM value=routeros
/container/envs/add list=ispbox key=ISPBOX_LOG_LEVEL value=info
/container/mounts/add list=probe-data src=usb1/ispbox-probe dst=/data

/container/add remote-image=ispbox-probe:latest interface=veth-probe \
    root-dir=usb1/containers/ispbox-probe envlists=ispbox mountlists=probe-data \
    dns=172.20.0.1 logging=yes start-on-boot=yes comment="ispbox-probe"

# wait for the pull and extraction to finish
:delay 60s
/container/start [find comment="ispbox-probe"]
tmpdir has to be on the external disk or the pull runs out of space on internal flash. The container resolves names through the router (dns=172.20.0.1), which is why the router has to answer DNS requests; if your firewall drops input by default, accept DNS (udp/tcp 53) from 172.20.0.0/24 on the containers bridge, and never open 53 to the WAN. local_retention_days: auto plus a disk limit is the right setting on a router: keep whatever fits, drop the oldest already-shipped day when it does not. If your firewall drops forwarding by default, allow the container out as well. If /container/print still shows the image extracting after the delay, start the container again once it has finished.
4. Check it works
On a router, read the container log:
/log/print where topics~"container"You are looking for a line saying the probe connected, with its prober id, name and target count. In the panel the prober card flips from Pending to Online within a minute and the targets start filling in. The card carries everything the probe reports about itself: version (with an "Update available" hint when a newer release is published, see Probe updates), platform and architecture, enabled targets, unsynced backlog, how much history the local archive holds, a disk badge, last seen, a warning if the box's clock is more than 30 seconds out, and the last error the probe reported.
The local status page
The probe serves its own page, and this is the part worth knowing about before you need it: it works while your uplink is down. It is one self-contained HTML page with no external assets of any kind, drawn straight out of the local archive.
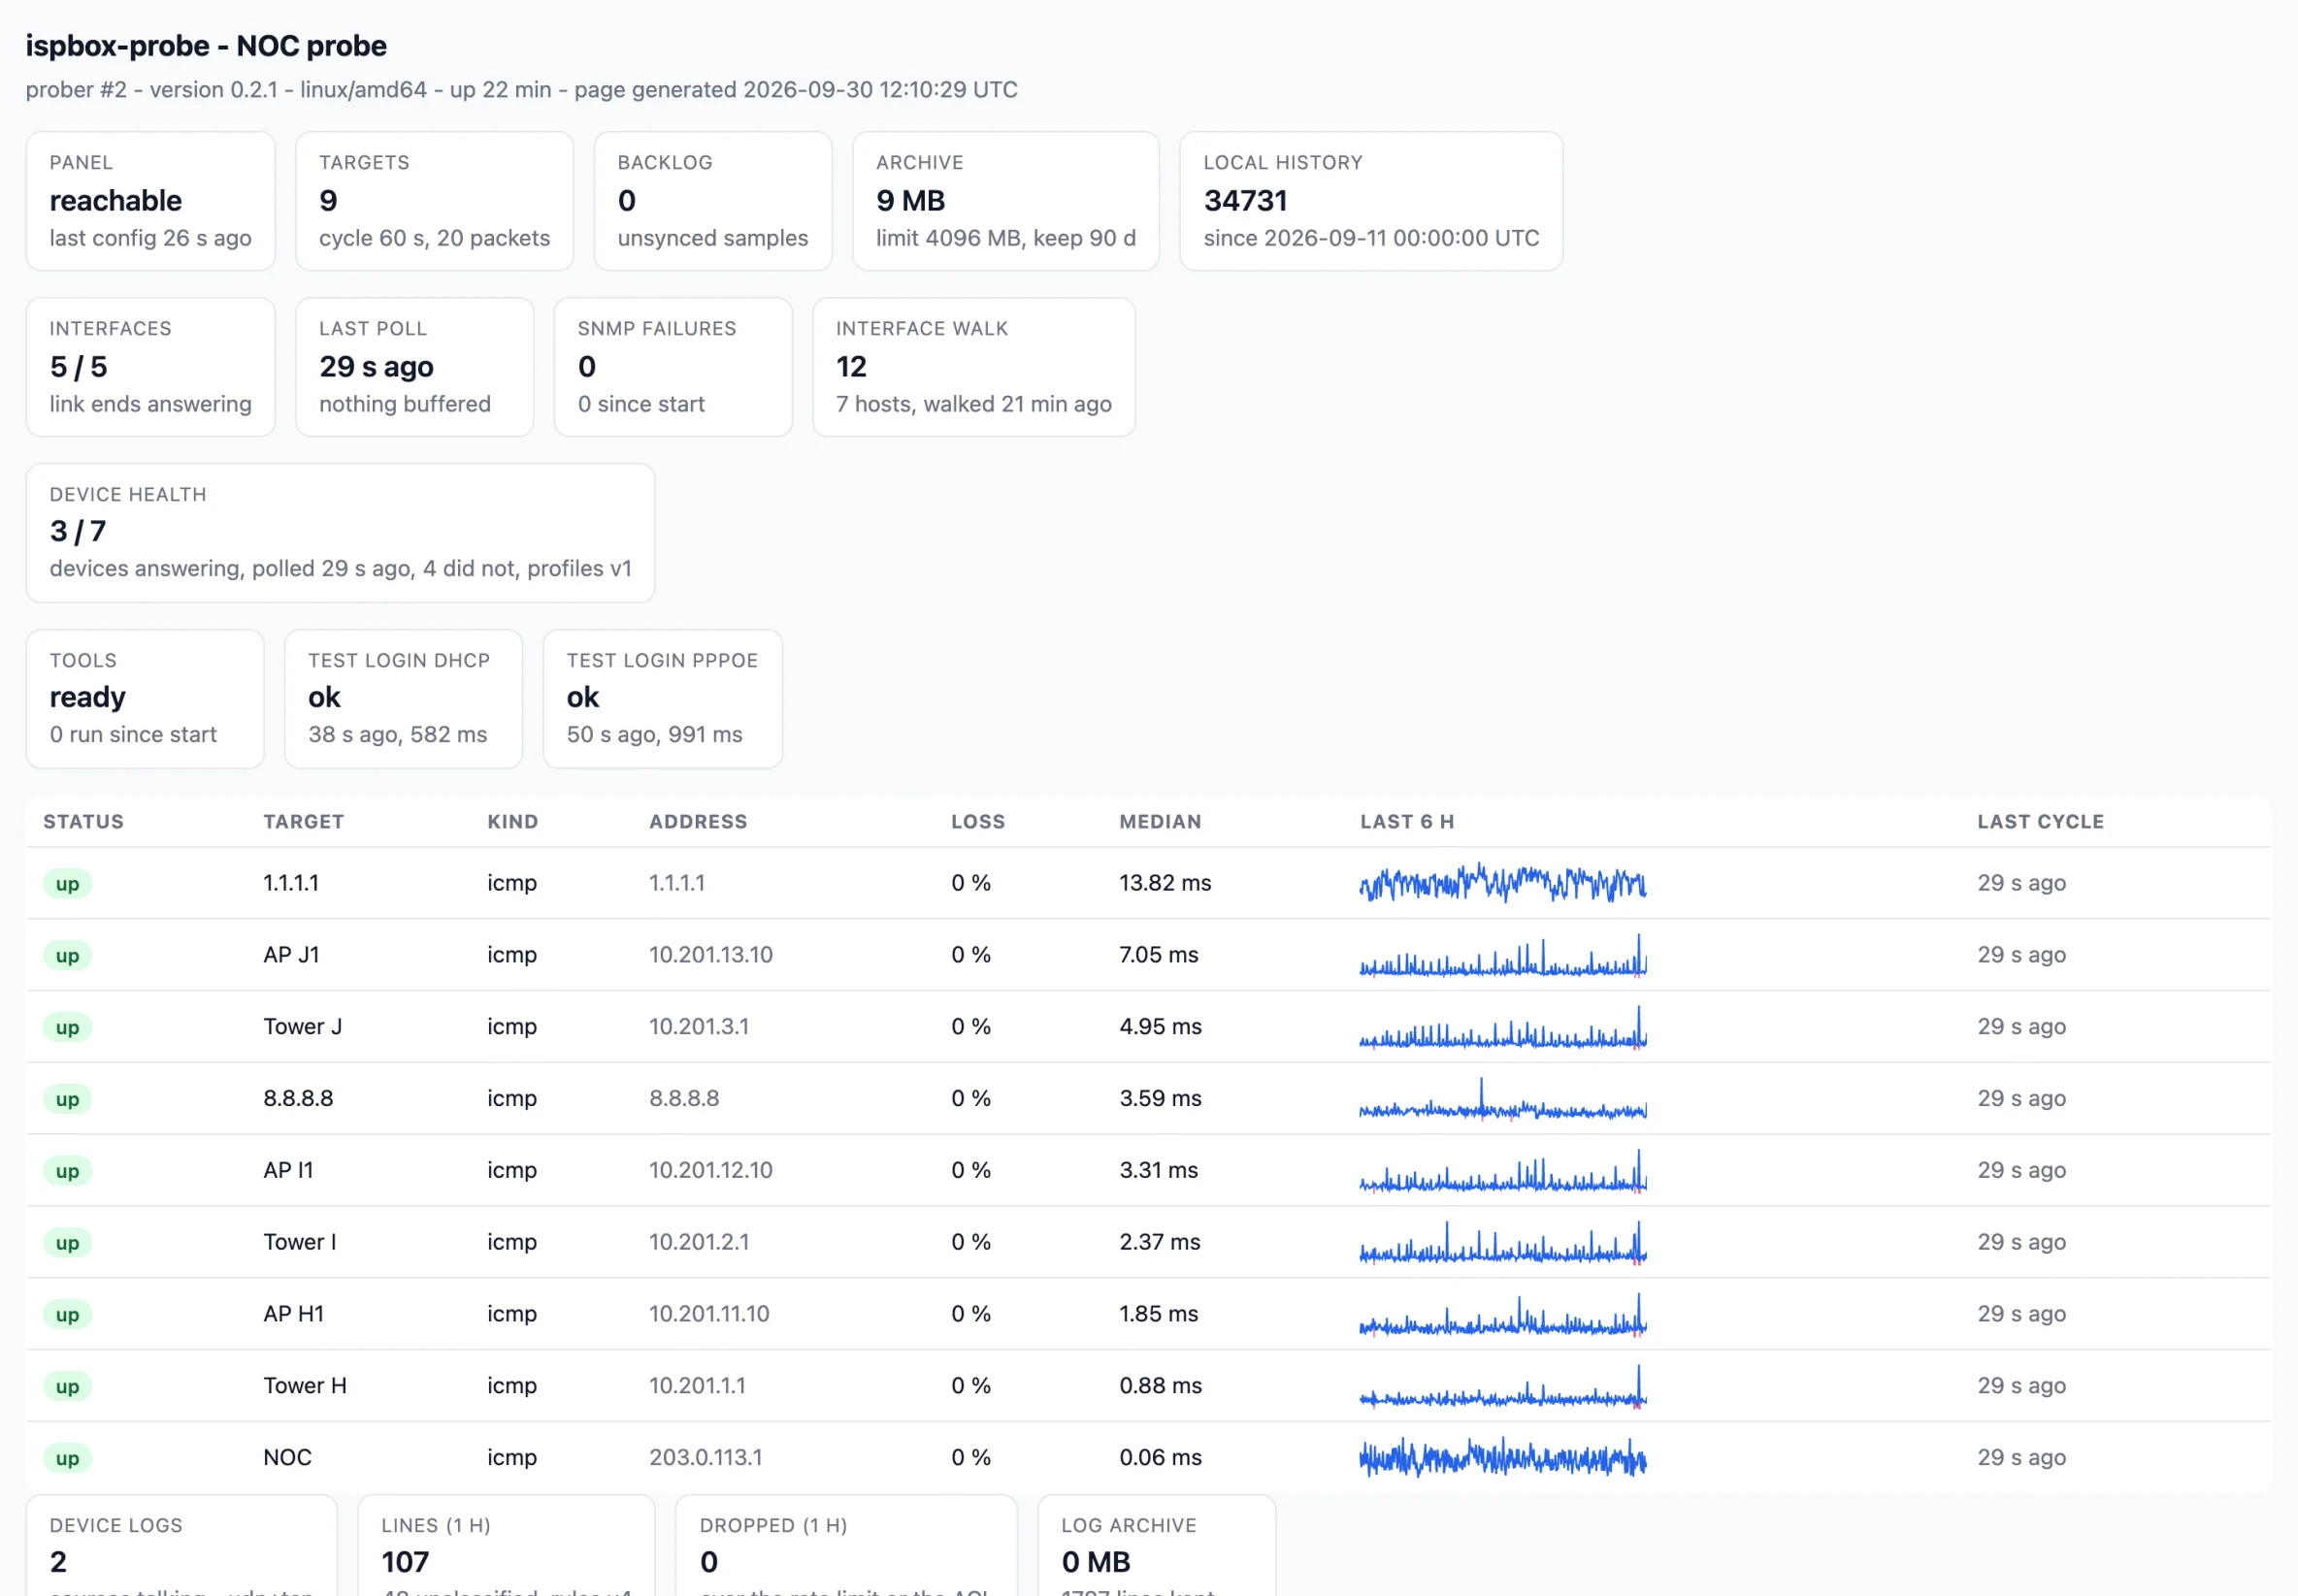
It shows every target with status, last loss, last median and a 6 hour sparkline, plus the probe's own health: whether the panel is reachable, the backlog waiting to be shipped, archive size against the limit, the oldest sample it still holds and the last error. It is what the NOC looks at while the panel is unreachable; the panel, the incidents and the diagnoses all catch up with the full history the moment the link returns.
By default it is bound to 127.0.0.1:8080, which means only the box itself can reach it. Set status_page (or ISPBOX_STATUS_PAGE) to 0.0.0.0:8080 to expose it on the LAN, and on Docker publish the port with -p 8080:8080. The RouterOS script above already does this, so on a router the page is at http://172.20.0.2:8080/ for any host that can route to the container subnet. Be deliberate about it: the page has no authentication, so anyone who can reach that port sees every target name and IP (device log details on it are partly masked). The probe logs a warning when you bind it wider.
Nothing is lost when the uplink is
Every cycle is written to the probe's own archive before anything is sent to the panel, and that archive is the buffer. When the panel is unreachable the backlog simply grows; when the link returns everything is shipped oldest first and the charts, rollups and history fill in behind you.
The archive is trimmed two ways: by age, and by size. When the file grows past its disk limit the probe drops whole days that have already reached the panel, oldest first. A day with data that has not been shipped yet is never dropped - instead, when there is nothing else left to evict, the probe stops recording, says so loudly in its log, and reports it in its heartbeat, which turns the disk badge on the prober card red. That is deliberate: the copy the panel does not have yet is the one worth protecting.
Keys, rotating and revoking
A probe key is ispb_probe_ plus 40 random characters. It is valid only on the probe endpoints - it is not an API key, it has no REST or MCP access, and it cannot read or write anything belonging to another workspace.
- Rotate key issues a new one and shows it once. The old key stops working immediately, so update the box in the same sitting.
- Revoke stops the probe pulling its configuration and pushing samples, without deleting its history. The box keeps measuring locally, and Rotate key brings it back.
- Delete refuses while the probe still has targets unless you tick Also delete its targets. Measurements already in the panel are kept.