Traffic Flows
With NetFlow or IPFIX switched on, your routers tell the probe who fills a link: which customers, which remote addresses, which services, and the saturation diagnosis names them.
The link page tells you a backhaul runs at 95 % every evening. Traffic flows tell you who fills it: which customers, which remote addresses, which services. Your routers already know; with NetFlow or IPFIX switched on, they tell the probe, and the link page answers "who uses this link".
Switching it on
1. On the probe. In Settings > Network monitoring > Probers, edit the probe and tick Collect traffic flows (NetFlow v5 / v9, IPFIX). The port is 2055 unless you change it. The probe accepts flows only from the subnets it already trusts (the same list as device logs), so a stranger on the internet cannot feed it. If the probe runs in Docker without --network host, publish the port as well: add -p 2055:2055/udp to its docker run line and start the container again (the ispbox-probe volume keeps its data). A docker run line the panel shows after flows are on (a new key for the probe) already carries it.
2. On the router. The form shows the line for a MikroTik:
/ip traffic-flow set enabled=yes interfaces=all
/ip traffic-flow target add dst-address=<probe address> port=2055 version=9
Set the export's source address to the router's address on the map (src-address=), so the probe knows which router is talking. NetFlow v5, v9 and IPFIX all work; other makes (Cisco, Juniper, Ubiquiti EdgeRouter, pfSense, a softflowd box) work the same way.
3. On the map. Open the link and, in Edit link, pick the interface at the exporting router's end. That tells the panel which interface's flows belong to this link.
Within a couple of minutes the probe card shows Traffic flows on 0.0.0.0:2055: 1 exporters, ... records in the last minute.
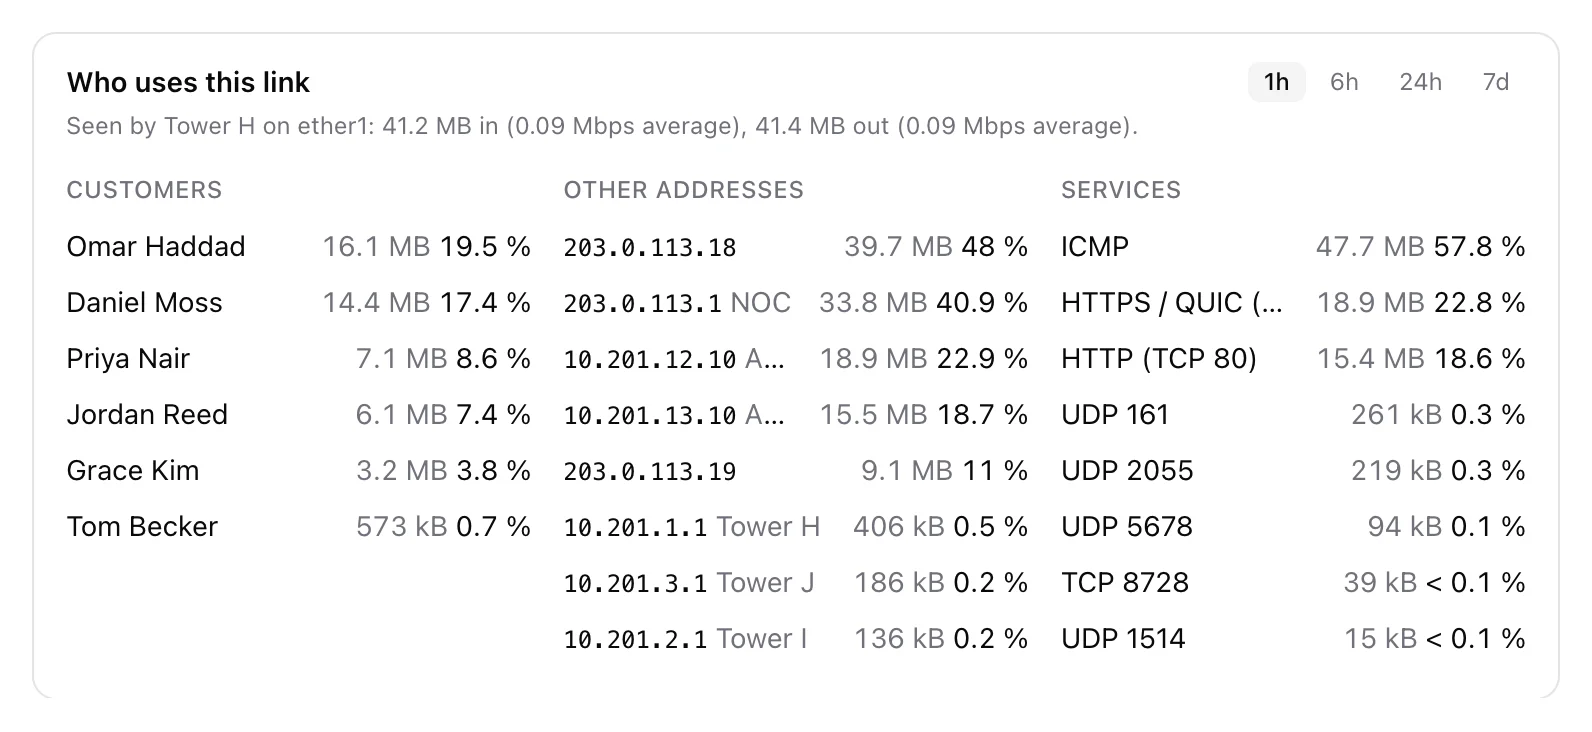
Who uses this link
The link page gets a Who uses this link card for the last hour, 6 hours, day or week:
- Customers: the customers behind the addresses, each with their bytes and share of the link, linked to the client page.
- Other addresses: the rest, named after the device on your map when it is one.
- Services: by protocol and port, in plain names (HTTPS / QUIC, DNS, WinBox ...).
An address is matched to a customer through the static address of their RADIUS login, their radio the monitoring measures, or their live RADIUS session. Names are looked up when you open the page, so an address that later belongs to someone else never rewrites last month.
Saturation with names
When the monitoring diagnoses a full link, the diagnosis now says who fills it, from the flows of the last quarter hour: Most of it is Alice Kowalski 38 %, Bob Nowak 21 %. That is the difference between "add capacity" and "one customer is backing up to the cloud every evening".
What the probe keeps
Raw flows never leave the probe and are not stored: at thousands a second they would cost more than everything else together, and nobody reads a single flow a week later. The probe folds them into one summary per minute, per router interface and direction: bytes, packets, flows, and the top 20 sources, destinations and services. Those minutes are written to the probe's own disk first and shipped from there, so an internet outage leaves no gap.
The panel keeps a week of minutes and a year of hourly summaries. A sampled export (1 in 100 packets, say) is scaled back to real traffic.
Good to know
- The probe's own status page shows the flow collector: exporters, records a minute, packets that arrived before the router sent its templates, and anything dropped.
- A router that exports before sending its templates (NetFlow v9 and IPFIX describe their records in templates) is counted, not guessed; its flows appear as soon as the templates arrive, usually within a minute.
- Tested with RouterOS 7.24 exporting NetFlow v9 and IPFIX.