Network Tools
Run MTR, ping, TCP, DNS, HTTP and SNMP tests from any of your probes and watch the result live in the panel, without opening a shell on anything.
When a customer says "it is slow", the useful test is not one from your office. It is one from inside your network, next to their tower. The network tools run MTR, ping, TCP, DNS, HTTP and SNMP tests from any of your probes and show the result live in the panel, without opening a shell on anything.
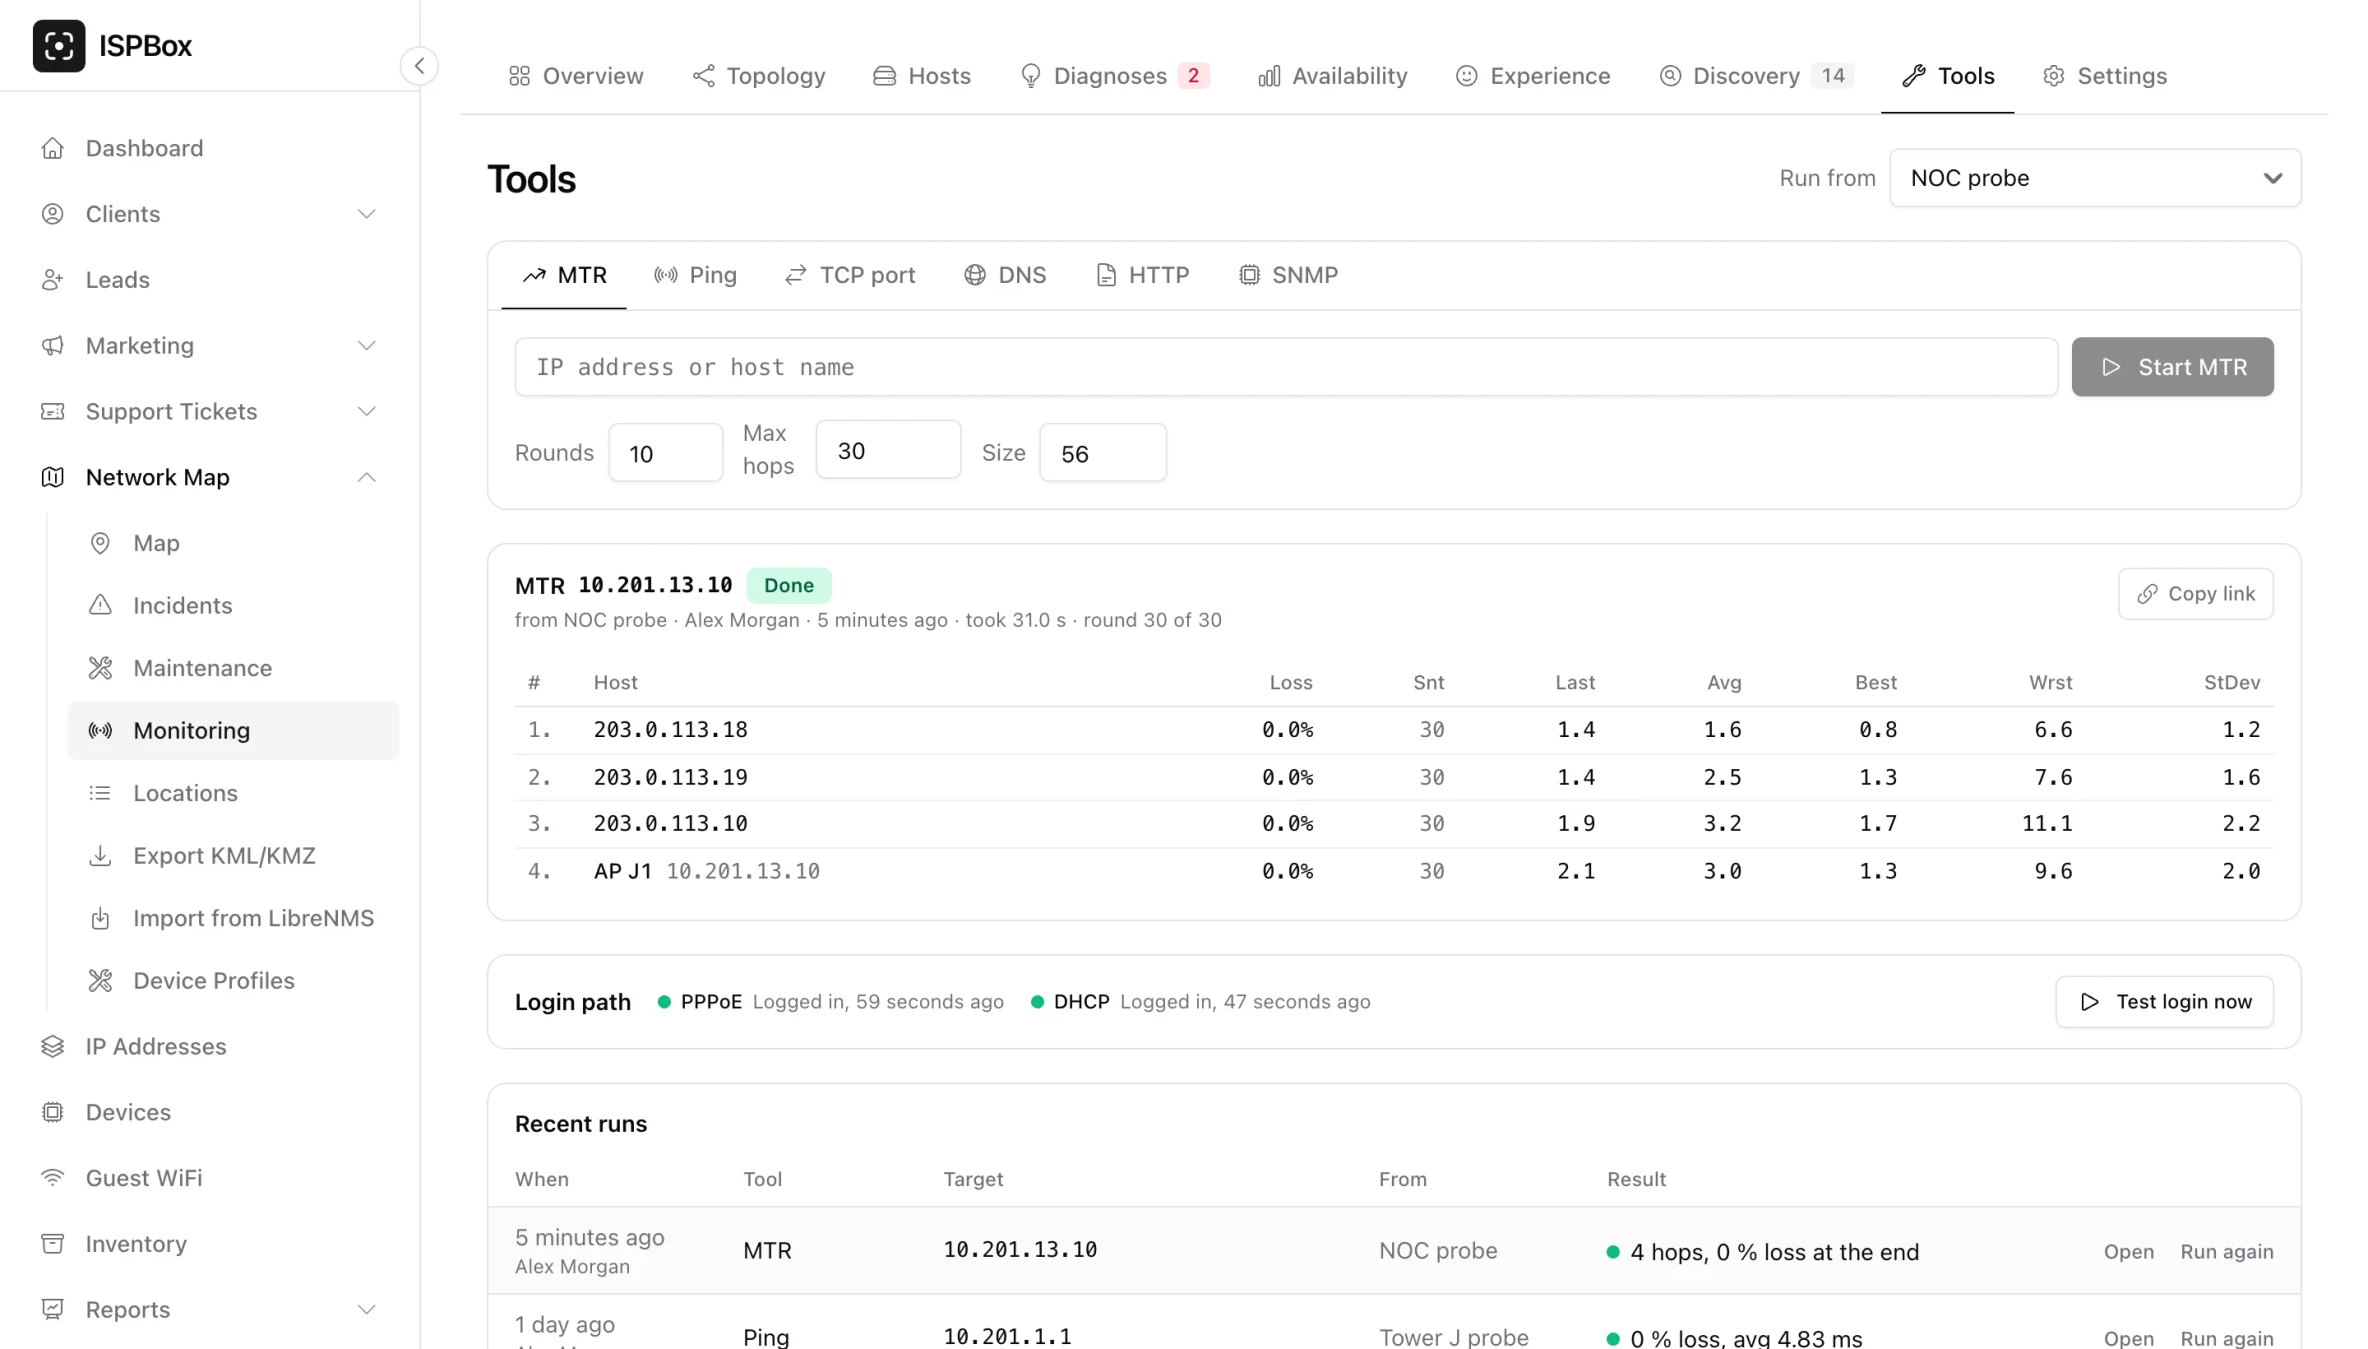
Open Network Map > Monitoring > Tools, pick the probe to run from and a tool, type an address and press the start button (Start MTR, Ping and so on).
The tools
- MTR: every hop on the way with loss, last, average, best and worst latency and the variation, updated round by round like mtr's own screen. Hops are named after your map and your monitored hosts. It is the quickest way to see where on the path the loss starts.
- Ping any address: every round trip on a strip, lost ones in red, with loss, minimum, average, maximum and jitter.
- TCP: how long it takes to connect to a port, a few times over.
- DNS lookup through a server you choose or the probe's own resolver: A, AAAA, MX, TXT, NS or PTR, with answers and TTLs.
- HTTP GET with a timing breakdown (lookup, connect, TLS, waiting for the server, download), the status, a redirect it did not follow, and the certificate's expiry.
- SNMP: test a device (system name, description, object ID and uptime), get up to 20 values, or walk one branch, with one of your stored SNMP profiles (v1, v2c or v3).
Opening the Tools page wakes the probe up: for ten minutes it asks for new work every two seconds, so a run starts almost at once. Outside that a request waits for the probe's next regular check-in, at most a minute; the page says so.
One click from the problem
You rarely need to type an address. MTR from prober and Ping now (100) are on every host page and in the topology side panel, Trace is on a link page, and Test SNMP is on a host page and in the SNMP profile dialog, each from the probe that measures that device.
In the SNMP profile dialog, Test SNMP reads one device with exactly what the form says, before you save the profile. Typed passwords are kept only until the probe has the request, and are never written to a table, a run or the audit log.
Sharing and history
Every run gets a number and a link (Copy link) to send to a colleague. Recent runs of the last seven days are listed with a one-line result and Run again. Tool results are kept seven days and never mixed into the monitoring's measurements, charts or diagnoses.
Safe by default
- Loopback, link-local (including the 169.254.169.254 cloud metadata address), multicast and broadcast addresses are refused, in the panel and again on the probe after the name is resolved. Private and CGNAT ranges are allowed: that is the point.
- At most two runs at a time per probe, 30 per person per ten minutes and 120 per probe per hour, with caps on counts and durations.
- Every run and every stop is in the audit log: who, what, where, and from where (the panel, the API or the MCP server).
disable_tools: truein a probe's ownprobe.yamlswitches the tools off on that box, whatever the panel says.- Ping and MTR share the probe's packet budget with the measurements, so a long MTR never disturbs the monitoring.
Good to know
- Running a tool needs permission to manage the network map.
- The probe's own status page shows whether the tools are ready and what ran last.
- The tools work from a probe inside a MikroTik container too.
- The REST API and the MCP server can start a run and read its result.