Network Monitoring Settings
The eight tabs of Settings > Network monitoring: probers, SNMP profiles, links and capacity, alert policies with their hysteresis, what is measured and kept, device logs, test logins and notifications.
Everything the network monitoring module is configured with lives on one page: Settings > Company & System > Network monitoring (also the Settings tab at the top of every monitoring page), eight tabs. This article walks through them in the order you will need them.
Probers
Where probes are created, edited, re-keyed and removed. Installing one is a longer story with a RouterOS section of its own - see Install the network probe. This tab is where you come back to afterwards.
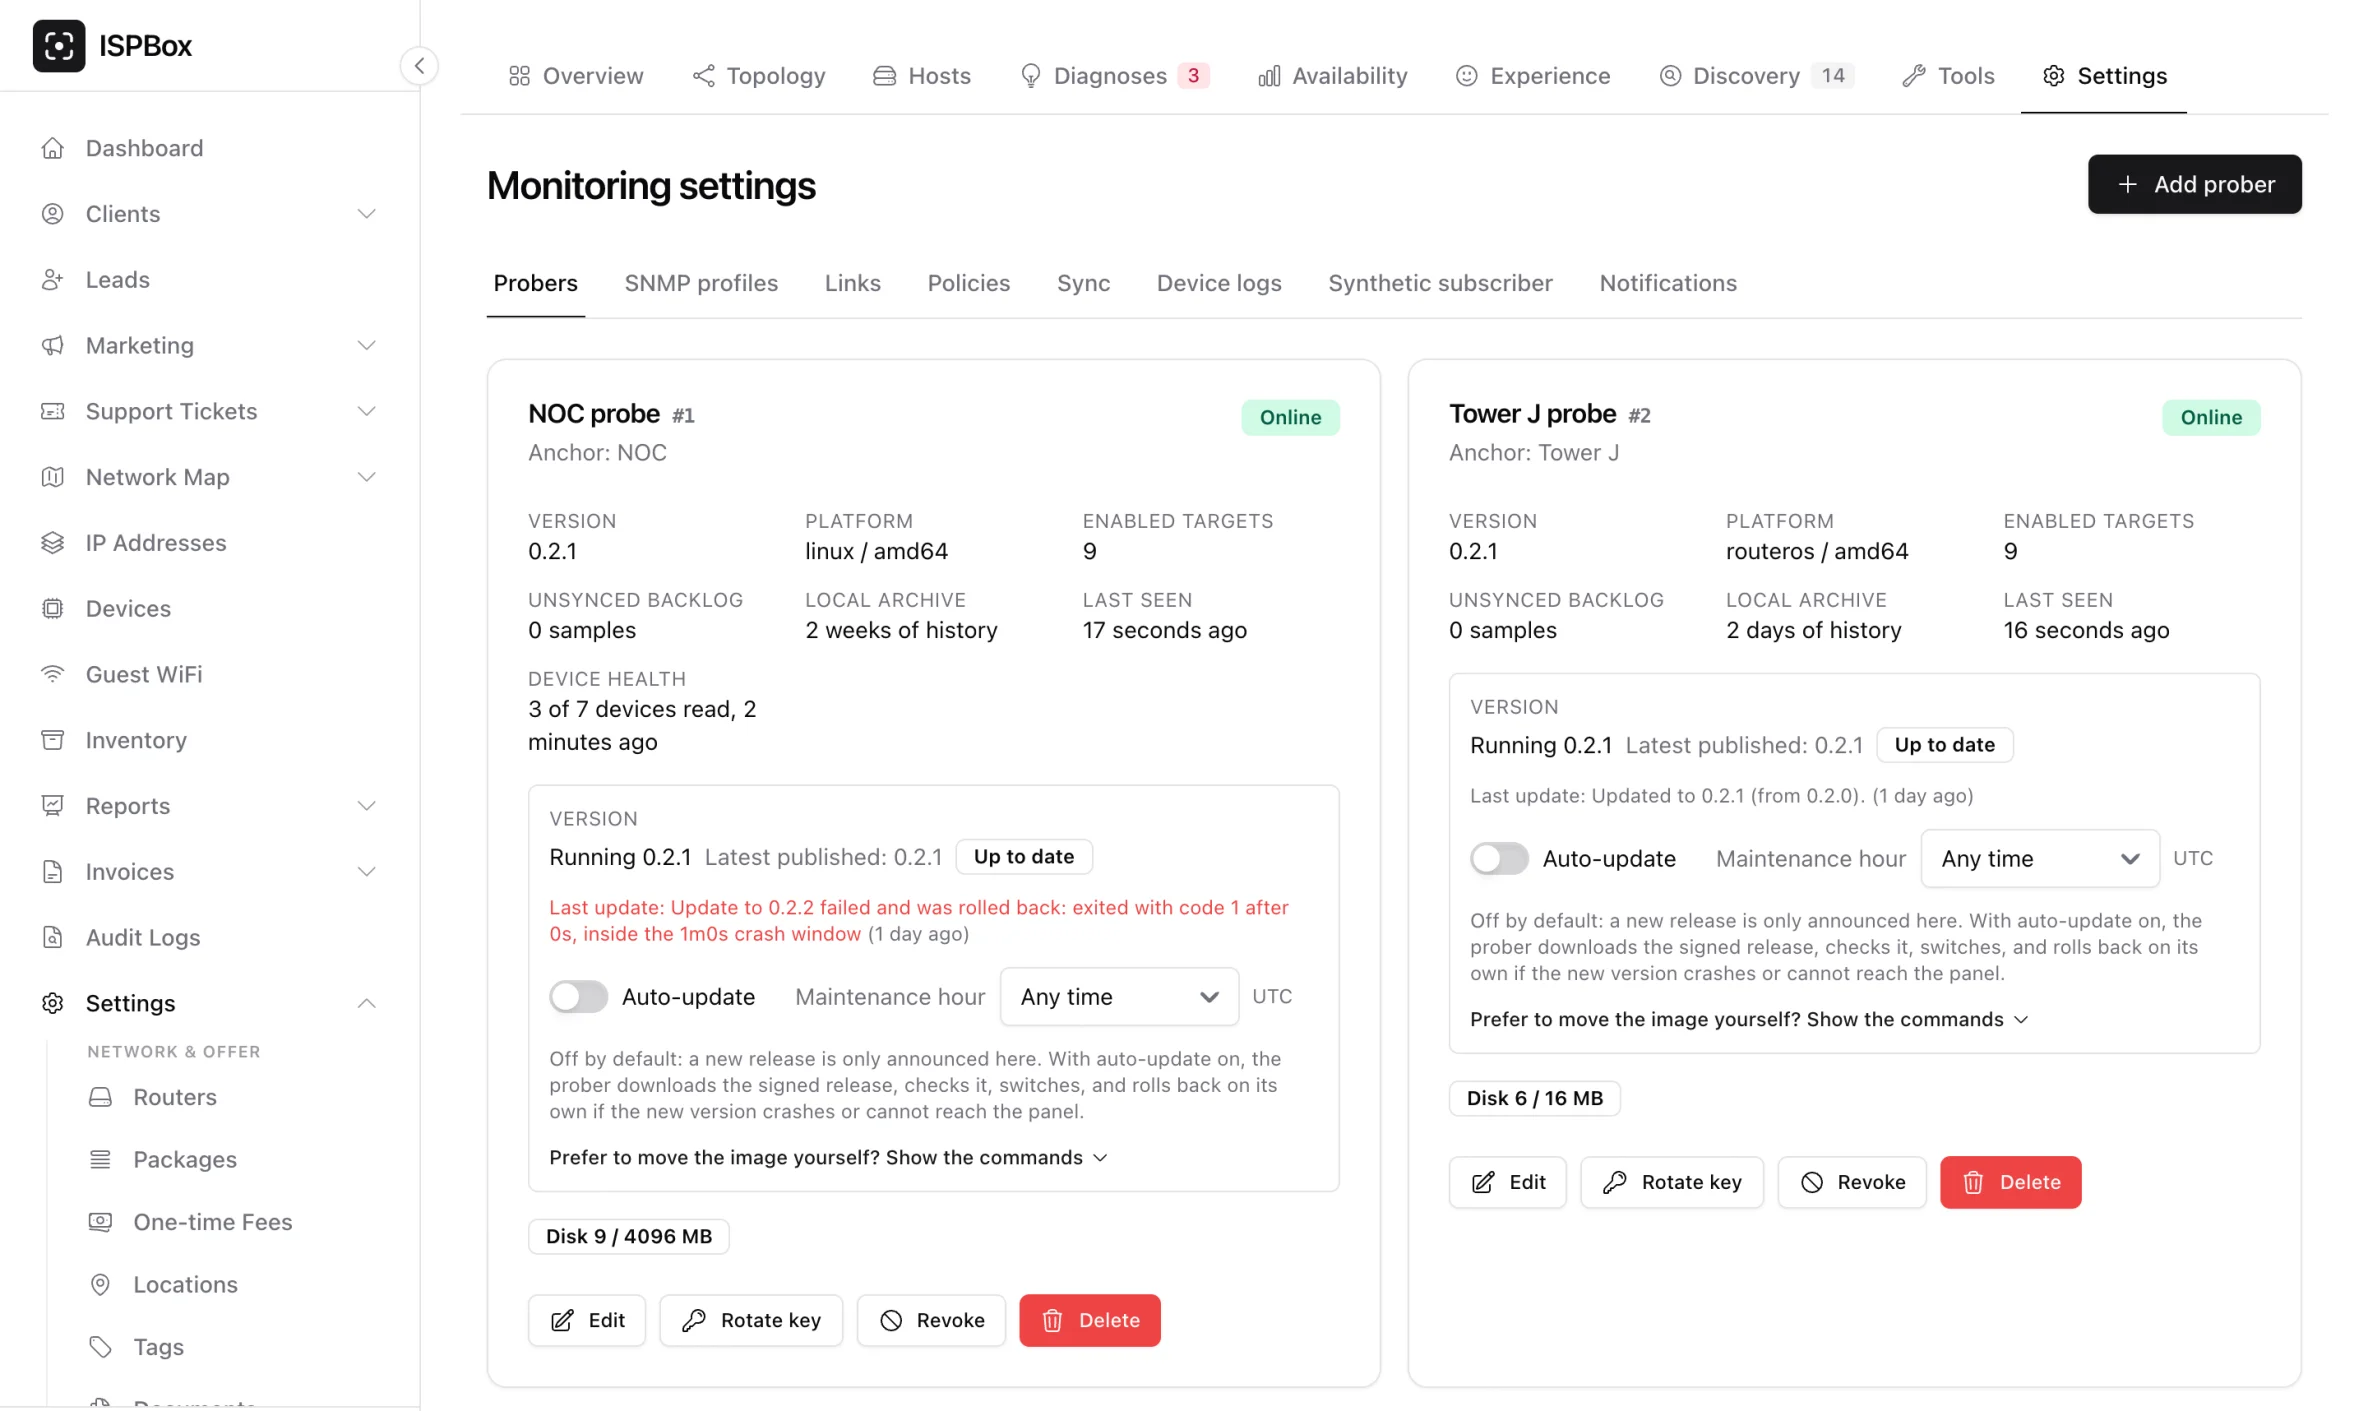
Each card carries everything the probe reports about itself in its heartbeat:
- Status - Pending (never seen), Online (heard from in the last 3 minutes), Stale (within 15), Offline, or Revoked.
- Version, with an "Update available" hint when a newer release is published, and the Version row with Update now and Auto-update - see Probe updates.
- Platform and architecture -
linuxorrouteros, and which CPU it is running on. - Enabled targets and unsynced backlog. A growing backlog means the probe is measuring but cannot reach the panel.
- Local archive - how much history the box is holding - and a disk badge that turns red when the archive is full and the probe has had to stop recording.
- Last seen, and a warning when the box's clock is more than 30 seconds off ours, because a probe with a bad clock produces samples the panel refuses.
- Device health (how many devices the last health poll read), the traffic flow listener when flows are on, the last error the probe reported, and a warning when its traceroutes leave the path drawn on the map.
A probe that is Pending or Offline also gets a Waiting for the first heartbeat or Troubleshoot button, which opens the install command and a checklist. Revoke cuts the probe off without deleting it; Rotate key issues a new key and brings a revoked probe back.
Editing a probe changes the shape of a cycle: cycle length (60-900 s), packets per cycle (5-50), the gap between packets (200-2000 ms) and the per-packet timeout (500-5000 ms). One cycle must fit inside itself - packets times interval, plus the timeout, must not be longer than the cycle - and the form refuses a combination that does not. The defaults, 20 packets a second apart every 5 minutes, are what the whole design is sized for.
The switches on this form are Poll interface counters over SNMP (with Read device and radio health and its interval under it), Collect traffic flows (NetFlow v5 / v9, IPFIX) with its UDP port, and Discover neighbours and unknown hosts with the subnets to sweep. All are off by default and covered below and in Device health, Traffic flows and Network discovery. The same form sets the anchor, the local retention and disk limit, and the target limit.
Every save bumps the configuration version, so the probe picks the change up on its next pull, within a minute.
SNMP profiles
The SNMP credentials your probes use. For link utilisation the probe reads four values per bound interface (operational status, port speed, and the in and out byte counters) plus an hourly walk of interface names, aliases and speeds so the panel can offer you a picker. The same profiles are used for device and radio health, discovery and Test SNMP. There are no SNMP traps.
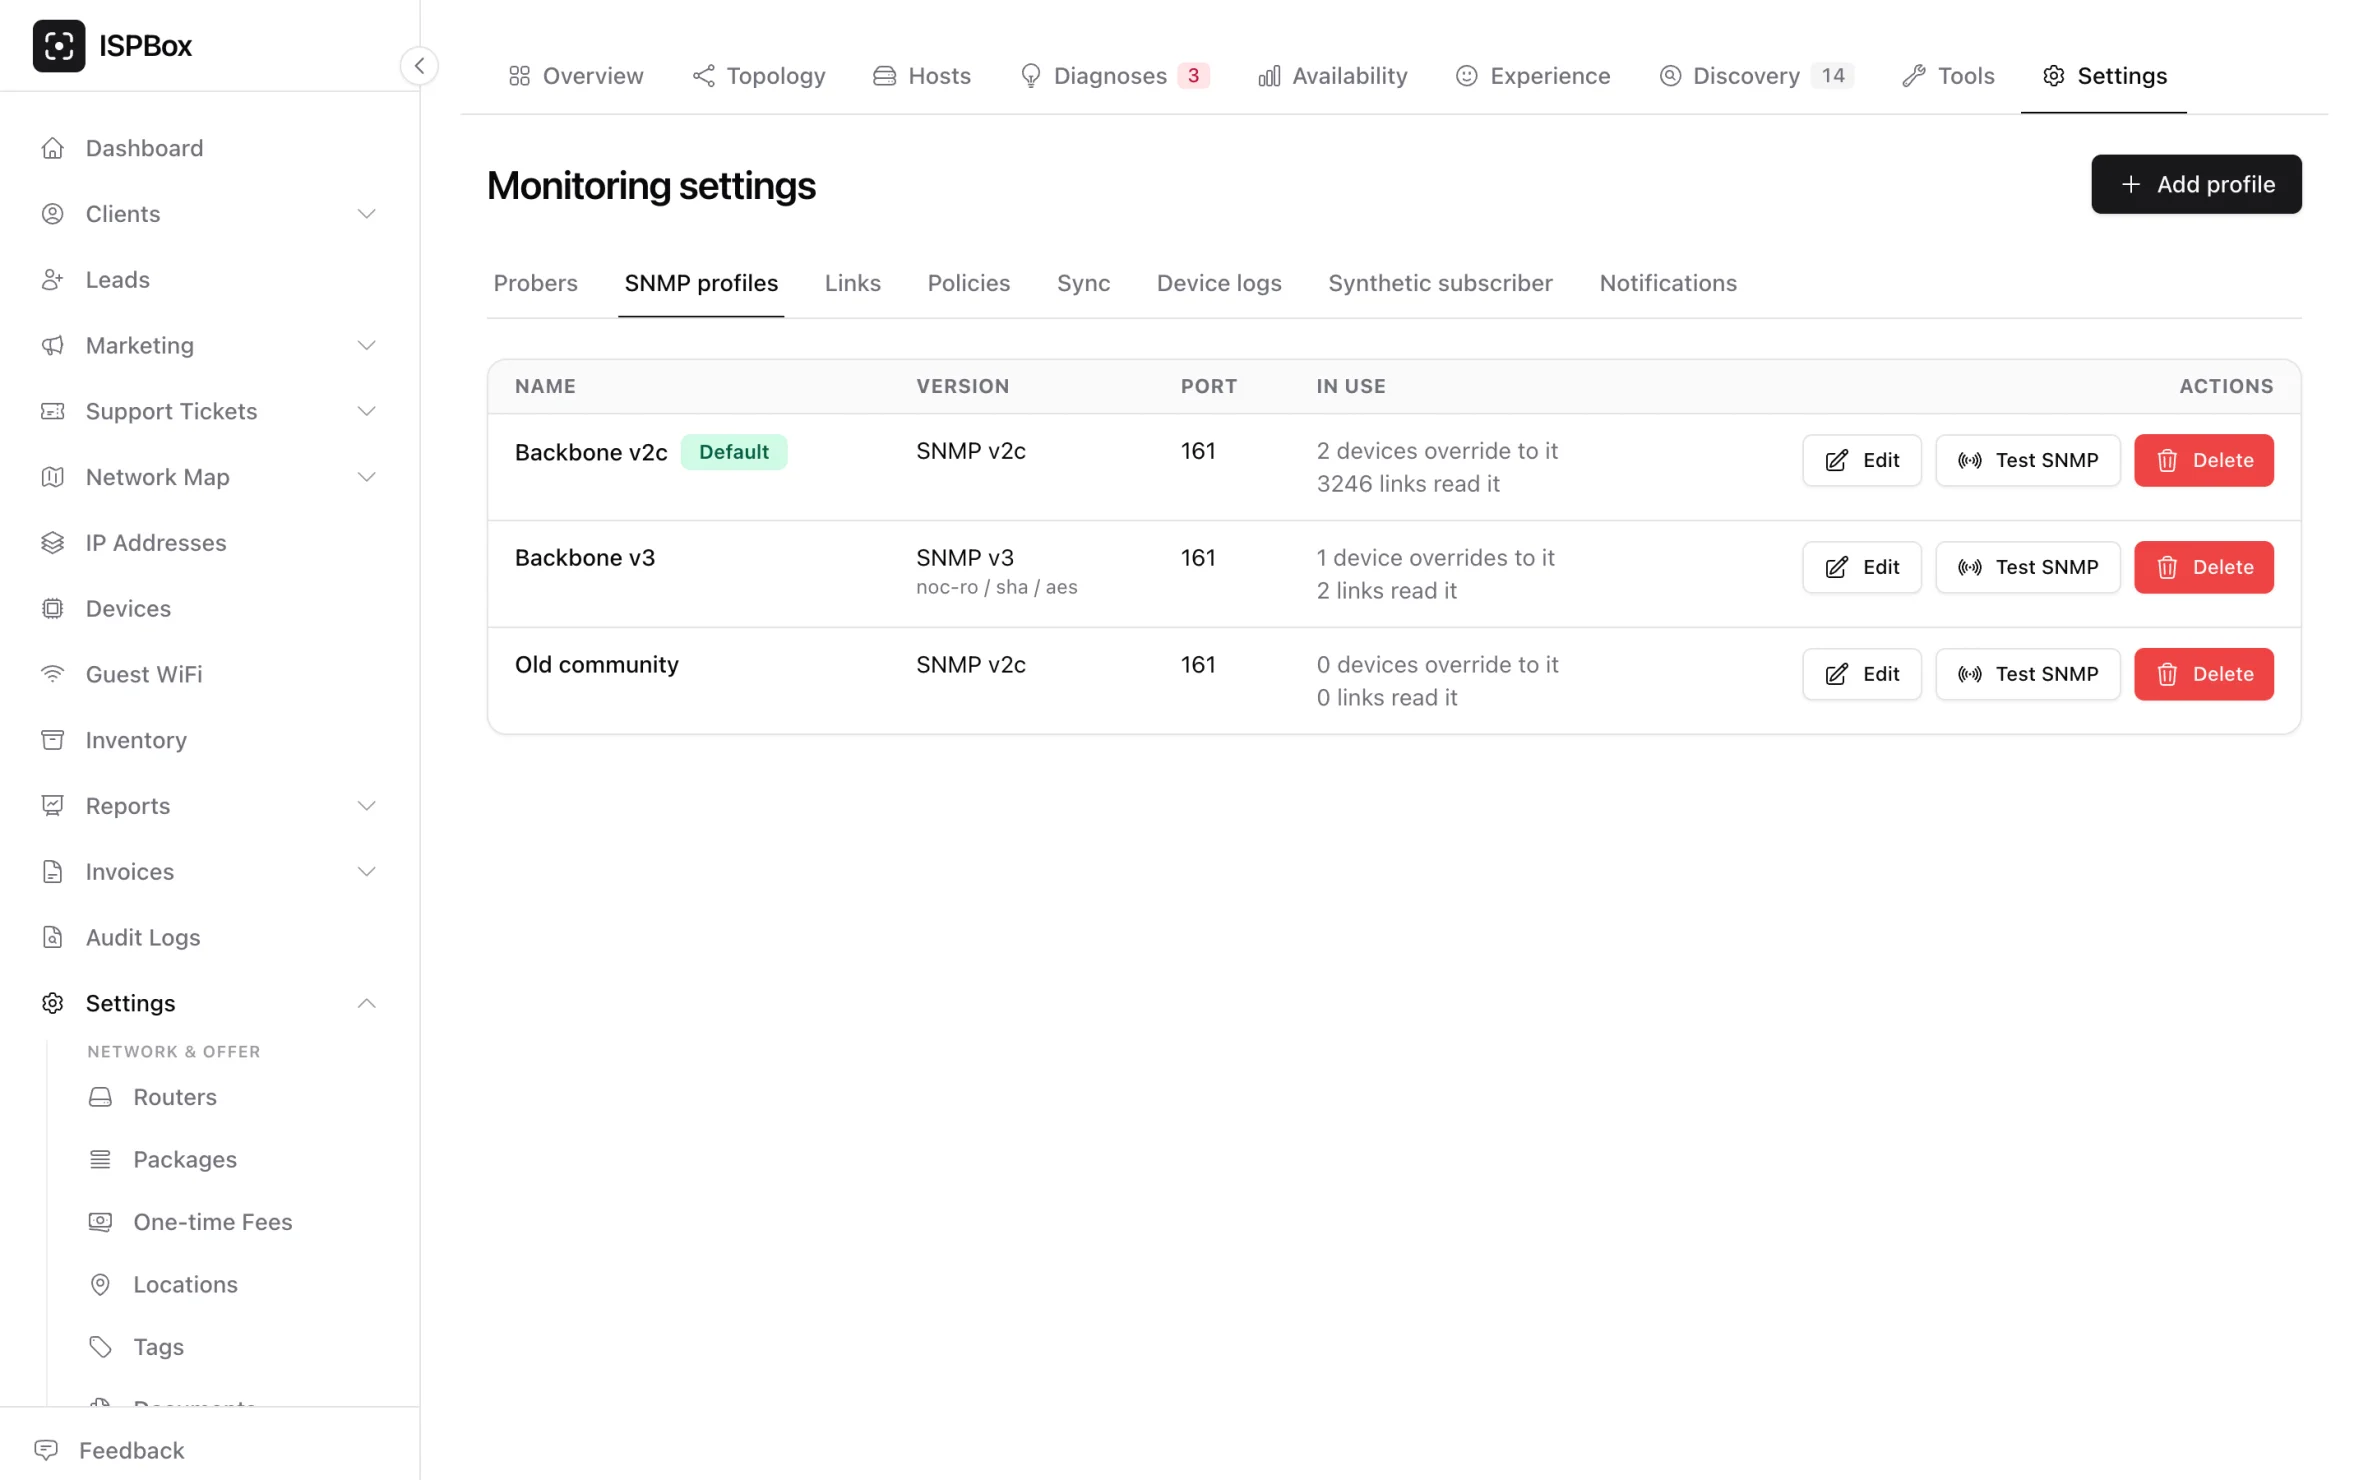
- v2c or v1 (a community string), or v3 authPriv (SHA, SHA-256 or MD5 with AES, AES-256 or DES). A v3 profile missing one of its passphrases is refused rather than quietly downgraded. Use v1 only for devices that answer nothing newer: v1 has only 32-bit byte counters, which wrap quickly on a busy link.
- One profile is the workspace default and there is always exactly one; anything without an override uses it.
- Secrets are encrypted at rest and never echoed back into the form - leave a field blank when editing and what is stored is kept.
- Deleting is refused while the profile is the default, or while any device overrides to it, and the count is named either way.
- Test SNMP reads one device through a probe with the profile, and in the profile dialog with exactly what the form says before you save it (see Network tools).
One thing worth knowing: a probe is only ever sent the profiles its own endpoints and discovery hosts reference, never your whole set. A box on a tower that somebody walks off with does not hand over the community strings for the rest of the network.
Links
Where a line on the map is told what it is made of. Two things are set here, and both change what the utilisation charts mean.
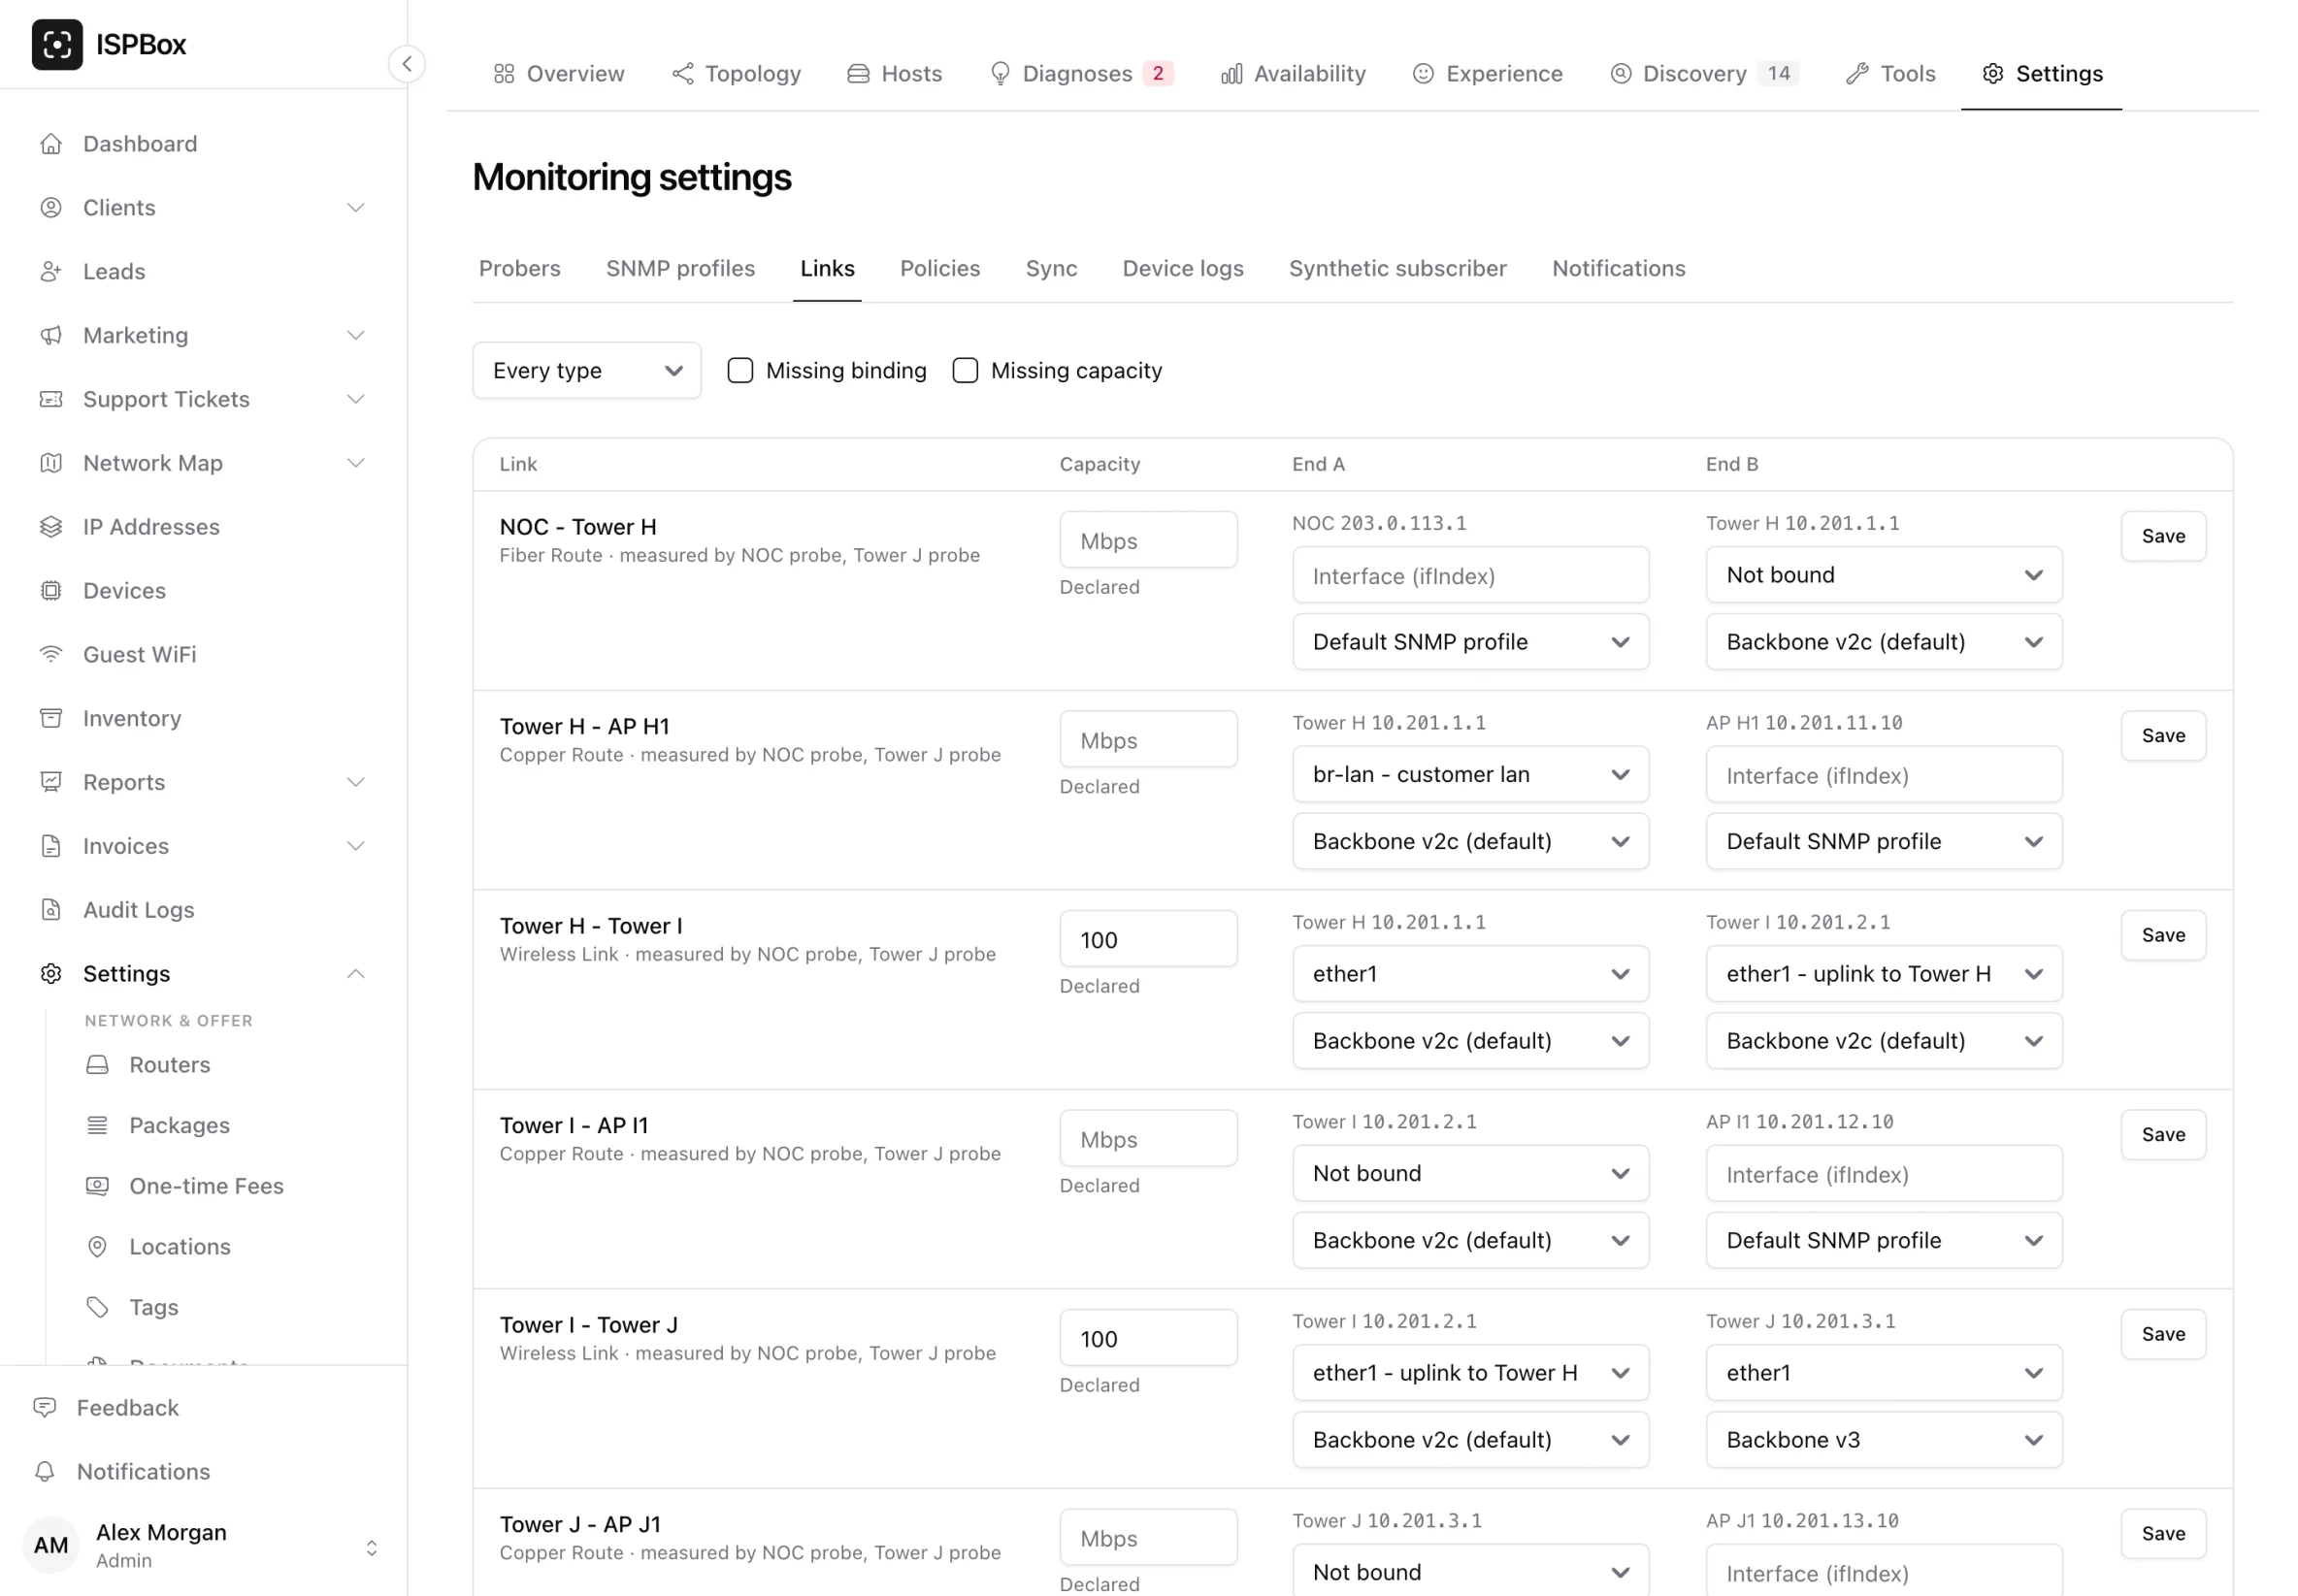
- Capacity - what the link is actually worth, in Mbps. Type a number and it becomes the declared capacity, which is what utilisation is measured against. Clear it and the panel falls back to whatever speed the port reports over SNMP. The source is badged everywhere a utilisation figure appears, and a wireless link reading a port speed carries an explicit warning that a gigabit Ethernet port is not the radio's actual throughput.
- Interface binding - which interface on each end carries this link. The picker fills itself from the hourly interface walk once a probe has read that device; until then you can type the ifIndex. Without a binding there are no counters, and without counters there is no utilisation.
- SNMP profile override per end, for the devices that do not use the workspace default.
Under each link's name you see its type, which probes measured it (or Not measured yet), and how many other lines are drawn between the same two devices. Filters at the top narrow the list to a link type, or to the links that are missing a binding or a capacity, which is the fastest way to finish the job.
Policies
The alert presets: what the module can raise, tuned on a real ISP network and shipped built in. What you own here are the numbers inside them, whether each one opens an incident, and who hears about it.
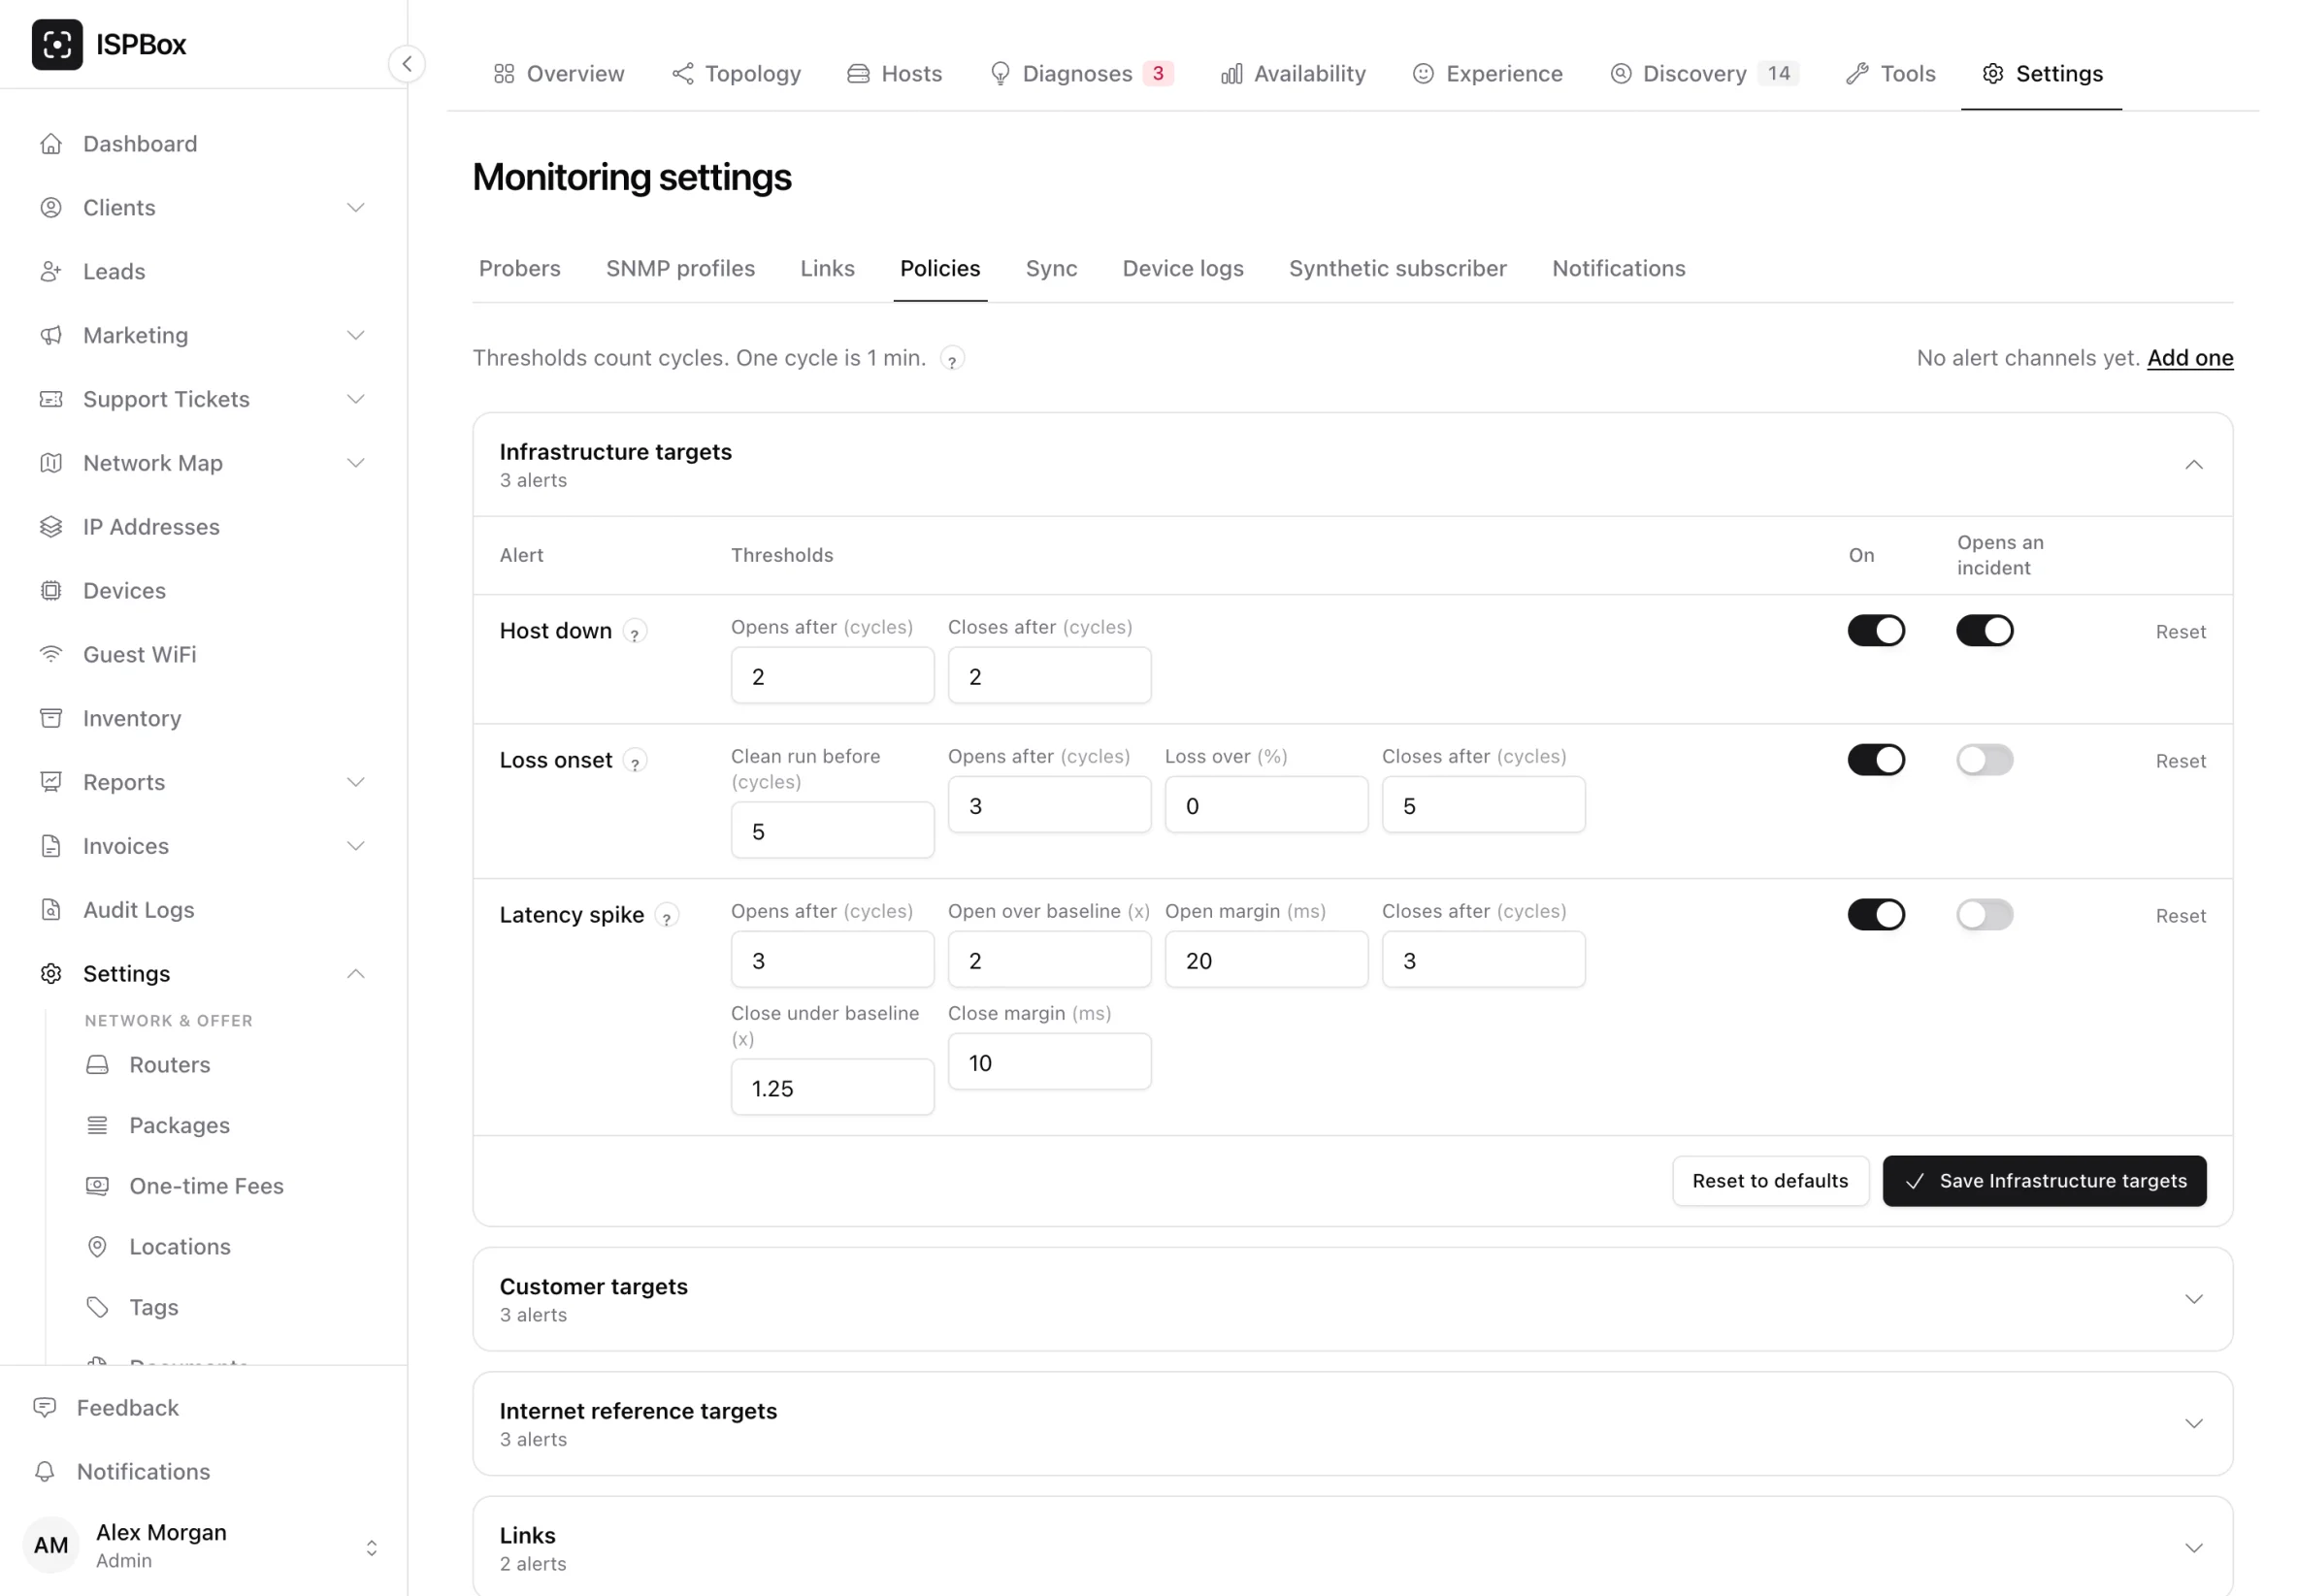
Three things are worth reading before you change a number:
- Presets count cycles, not seconds. The tab spells out what a cycle is worth on your shortest probe and what each threshold works out to in minutes, so "3 cycles" is never a guess.
- Opening and closing are deliberately different runs. An alert that opens on three bad cycles must not close on the first lucky one. That gap is the only thing standing between you and a flapping link sending a hundred messages a night.
- A cycle the probe never reported is not evidence. Nothing opens because a probe was offline; that is what the probe alerts are for.
The rows are grouped by what they apply to - Infrastructure targets, Customer targets, Internet reference targets, Links, Probers, Device health, Customer radios and Synthetic subscriber. Each group opens with a click and has its own Save and Reset to defaults. The first five:
- Host down - not one packet came back, for N cycles.
- Loss onset - a host that was clean for a run of cycles started losing packets. Loss onset (customer) is the same rule with a higher threshold, because a CPE on a busy Wi-Fi drops the odd packet all day and a tower does not.
- Latency spike - the median went far above this host's own baseline and stayed there.
- Link degraded - a link has been the root of a fault for N cycles.
- Link saturated - utilisation at or above the threshold (90 % by default) for a run of cycles, closing when it stays under 70 %.
- Prober offline and Prober sees nothing clean - the probe stopped reporting (it is still measuring and keeping the data locally, we just cannot see it), or nothing it measures is clean, which is a statement about its own uplink and not about your network. The thresholds of these two are fixed on purpose: one is driven by the same timing the status pill uses, and the other is a rule attribution itself has to agree with, so a second answer here would only be a way to disagree with yourself. You still choose whether each alert is on and who hears about it.
Device health (running too hot, CPU at its ceiling, unstable power, restarted, optic losing light) and Customer radios (weak customer signal) count health polls instead of ping cycles, and are covered in Device health. Synthetic subscriber (RADIUS, PPPoE and DHCP test logins failing) counts runs of the check; see Test customer login.
Each row has an on switch, an Opens an incident switch (on by default for host down on infrastructure and for link degraded, off for the rest), the alert channels it notifies (the Notify column appears once you have alert channels), and a Reset back to the shipped defaults - per row and per section. Rows are seeded the first time you open the tab and additively after that, so a preset added by a later release fills its own gap without overwriting a number you tuned.
Sync
What is measured, and how long it is kept.
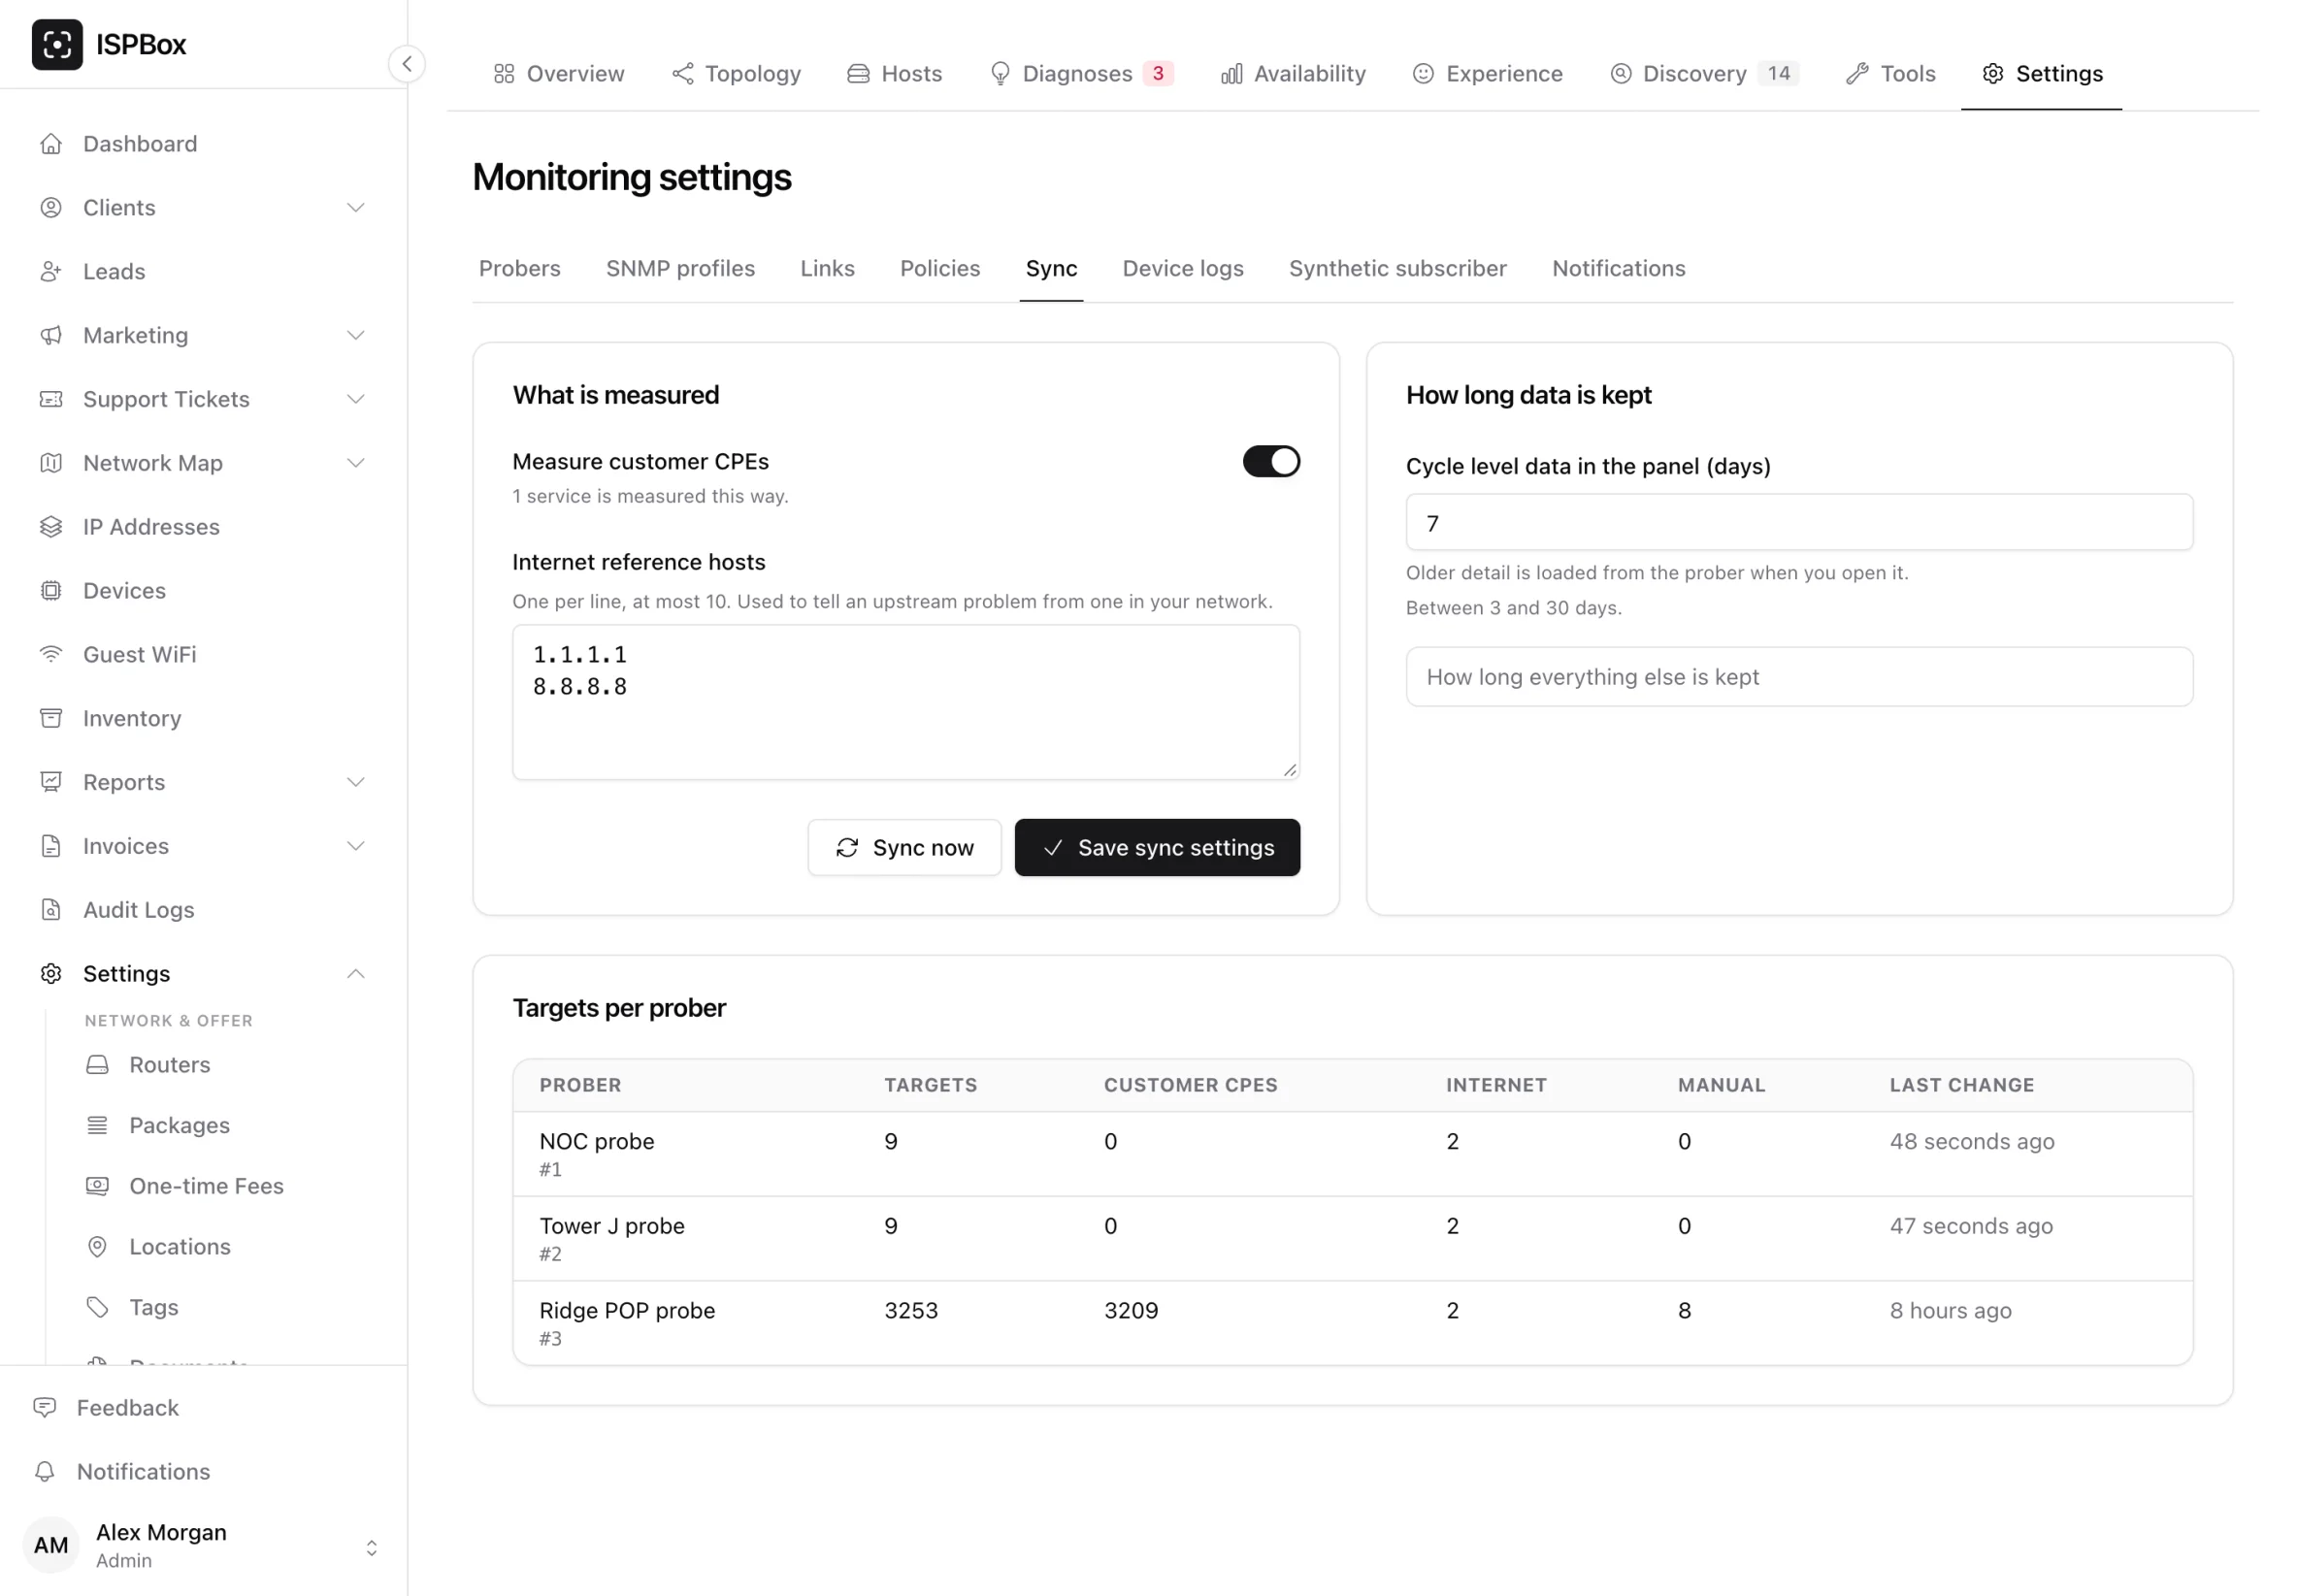
What is measured. Targets are built from your network map, your services and your routers - nothing here is typed twice. Draw the map and the target list follows. Two things are yours to set:
- Measure customer CPEs - one target per active service that has an IP. On by default. This is what makes a client page and a ticket show that customer's own connection instead of the tower above it. The tab shows the live count of services the rule would ask for.
- Internet reference hosts - one address or hostname per line, at most 10,
1.1.1.1and8.8.8.8by default. They are pinged from every probe and traced hourly, and they are what tells "our upstream is broken" apart from "our network is broken".
How long data is kept. The panel keeps a short working set of cycle-level data and the rollups forever; the long archive lives on the probe. The only number you set is the first one:
- Cycle level data in the panel - 7 days by default, between 3 and 30. Shorter is cheaper and loses nothing you cannot pull back, because a window outside it is fetched from the probe's own archive when you ask for it.
- Under How long everything else is kept: interface counters 7 days, per-cycle link verdicts 30 days, fetched windows 7 days, hourly rollups 2 years, daily rollups forever, the change feed 90 days, traceroutes 30 days, alert events forever, dismissed discovery candidates 180 days.
Sync now re-runs the target build for every probe (the button shows only to users who can manage the network map). You should not normally need it - map edits queue a sync by themselves and there is a nightly one - but it is there for when you want to see the effect immediately. The panel does not record when a sync last ran; it shows the result, which is the table at the bottom: per probe, how many targets exist, how many are customer CPEs, how many are internet references, how many were added by hand, and when the list last changed.
Device logs
Where probes are told to collect syslog from your devices, whether customer identifiers are hidden, whether the logs raise alerts, and which devices are sending. Everything on this tab is explained in Device logs.
Synthetic subscriber
Where a probe is set up to log in like a customer - a RADIUS check, a PPPoE login and a DHCP lease - so you hear about a login problem even while every ping is green. See Test customer login.
Notifications
Who hears about a diagnosis, and how loudly.
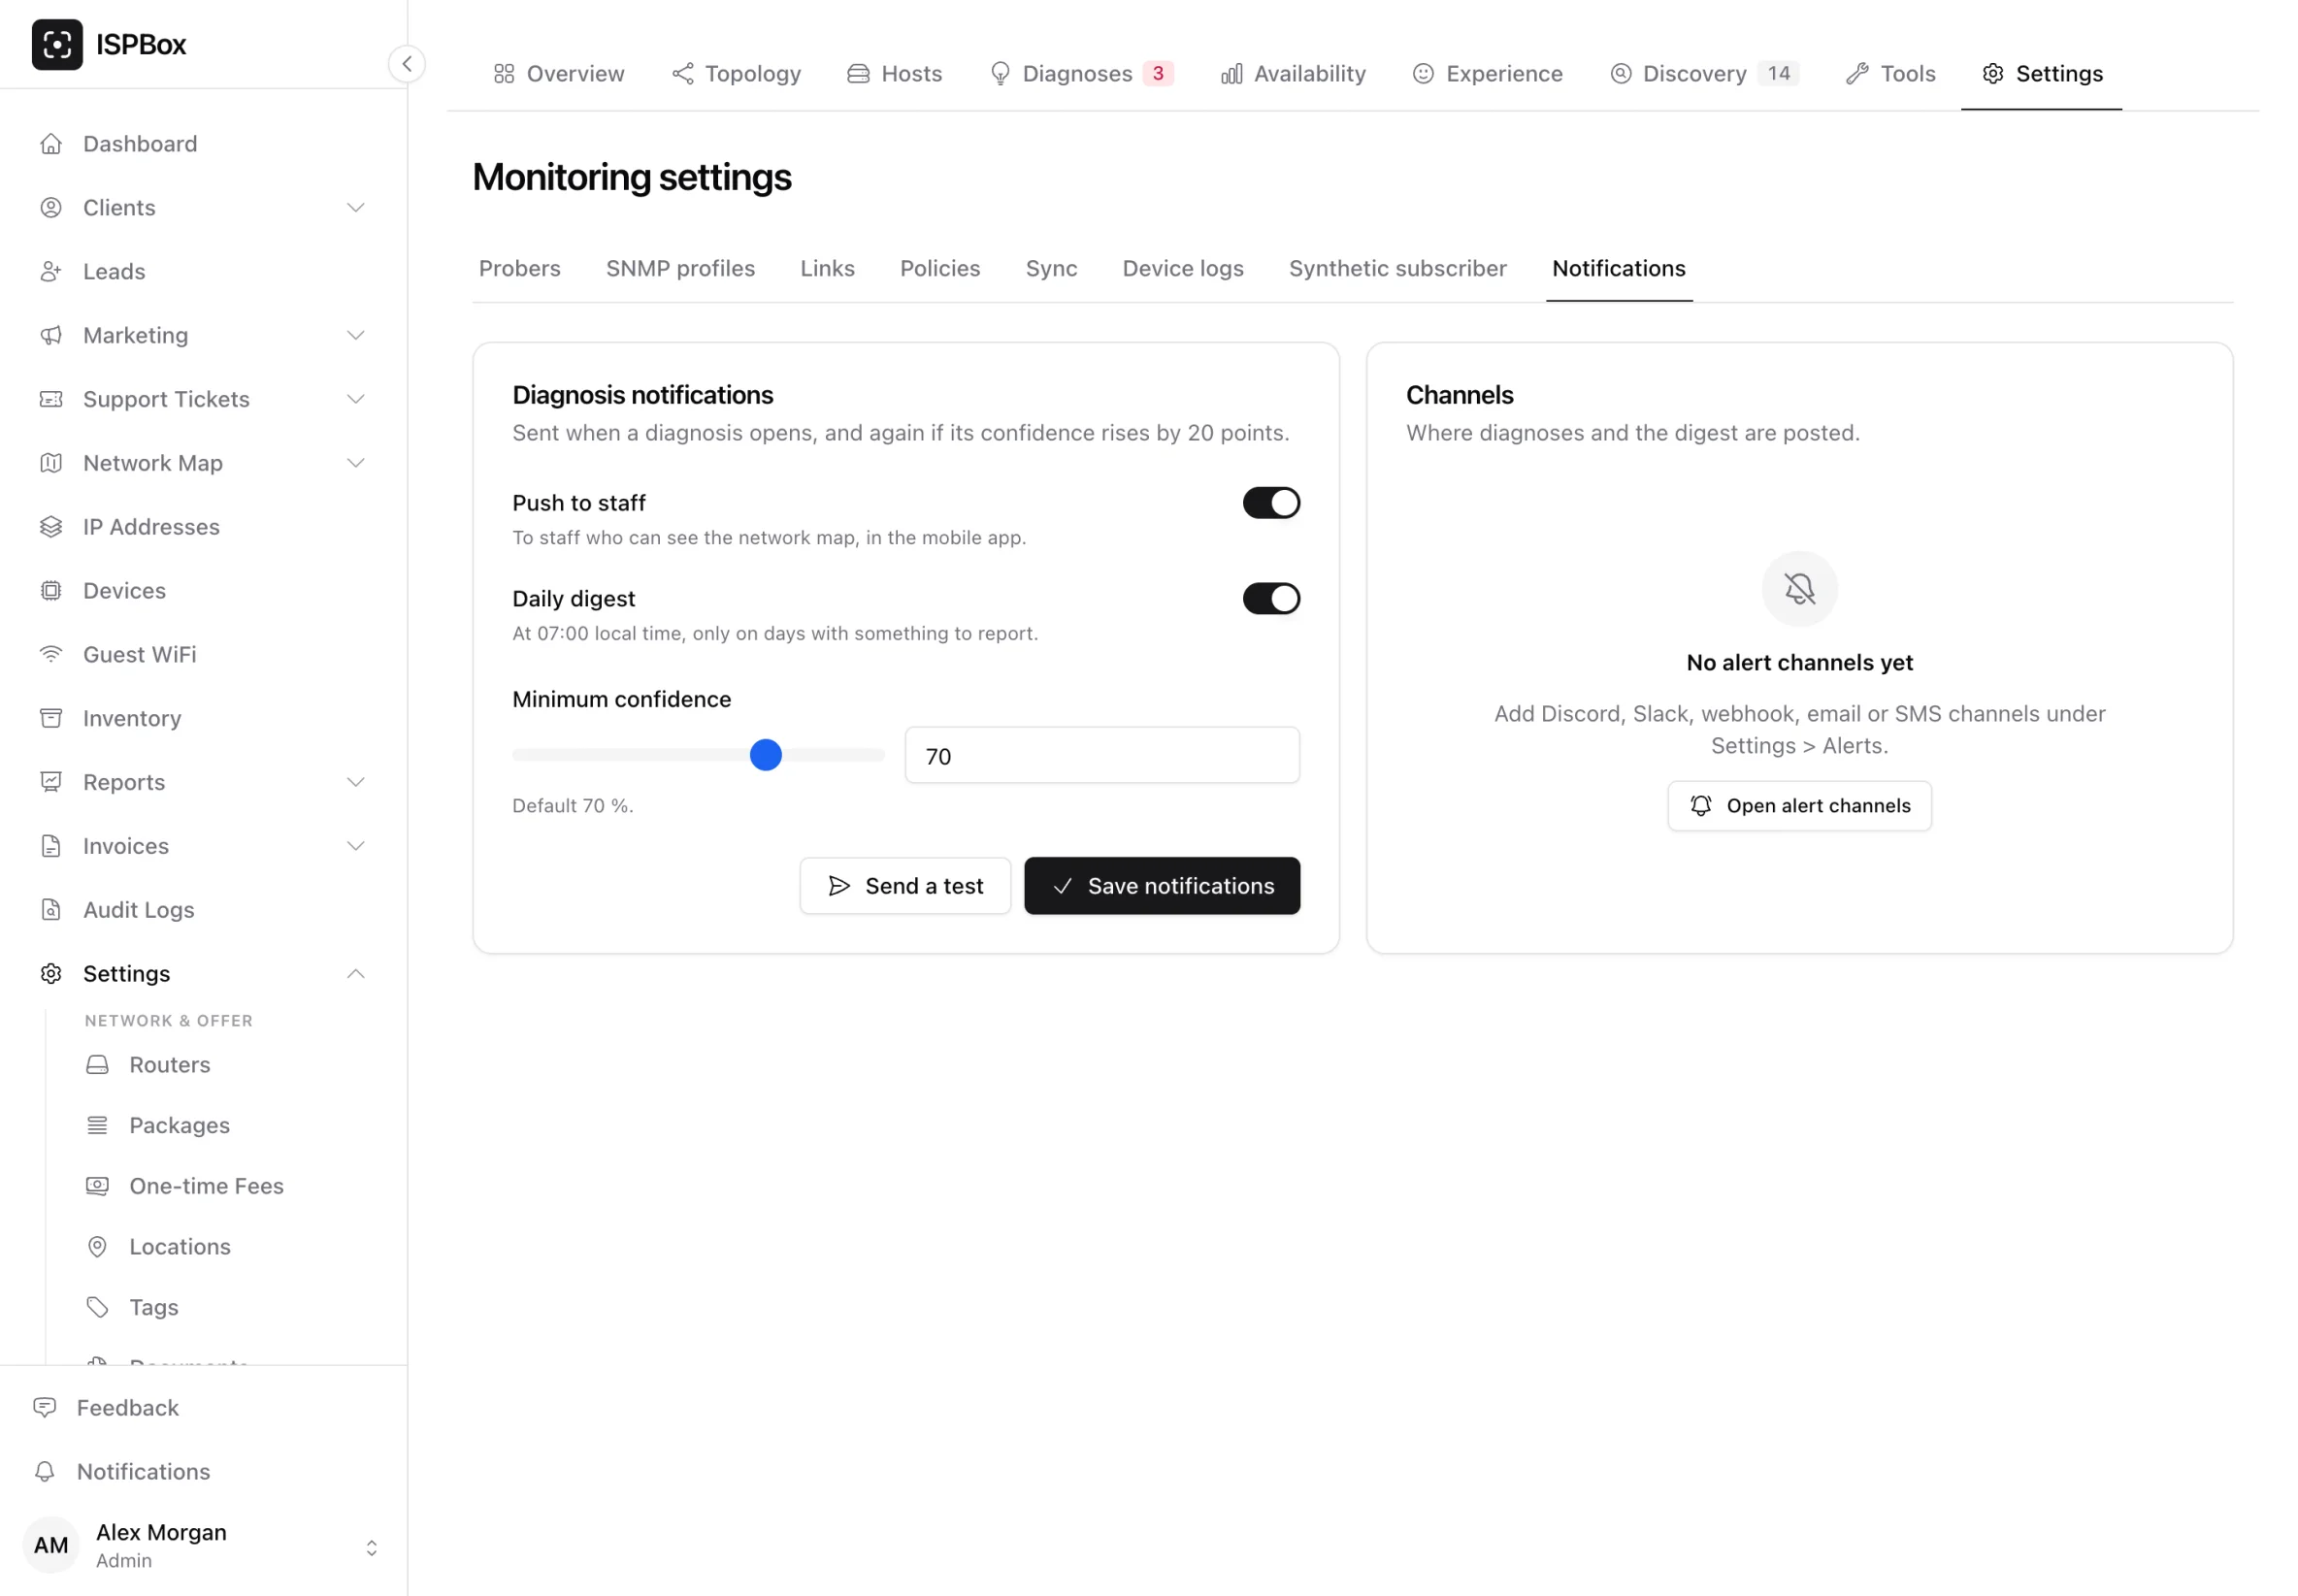
- Push to staff - everyone in the workspace who can see the network map gets it in the mobile app.
- Daily digest - at 07:00 in your own timezone: what is open, what is new since yesterday, the capacity forecasts and whether the probes are reporting. Nothing is sent on a quiet day.
- Minimum confidence - 70 by default. Lower it to hear about weaker hypotheses, raise it if the feed is noisier than your network.
- Channels - the workspace alert channels a diagnosis and the digest are posted to. They are the same Discord, Slack, webhook, email and SMS channels the rest of the panel uses, configured under Settings > Alerts; none are picked here until you pick them.
A diagnosis is sent once when it opens at or above your confidence floor, and again only when it has gained 20 points. Bumps in between stay quiet, which together with the "one open diagnosis per problem" rule is what keeps the feed from nagging.
Worth knowing: customer-safe wording is never sent anywhere by the module. Where a diagnosis has one, it is shown to staff as a suggested reply to copy, and that is all.
Send a test delivers a clearly-marked test message through everything that is switched on, which is the fastest way to find out that a webhook URL has a typo in it.