Device Health
CPU, memory, temperature, voltage, radio signal and the stations of an access point, read from your equipment over SNMP, kept as history and used in alerts and diagnoses.
Pings tell you a tower stopped answering. The tower itself can tell you it was running at 85 °C for an hour before that, that its input voltage kept dipping, or that a customer's dish has drifted to -79 dBm. Device health reads those figures from your equipment over SNMP, keeps a history of them, and uses them in alerts and diagnoses.
What is read
- The device: CPU, memory, temperature, input voltage, power draw, uptime, power supplies and fans, plus its model and firmware.
- The radio: signal, noise, SNR or CCQ, rates and capacity, frequency and channel width, TX power, distance.
- Every customer radio registered to an access point, with its signal, SNR, rates and how long it has been connected.
- Optics: receive and transmit power of each SFP, its temperature, bias and loss of signal.
The probe recognises the make of each device and reads it with the right profile. Profiles ship for MikroTik, Ubiquiti airMAX, LTU and airFiber, Cambium ePMP and PMP 450, and Mimosa, and a general profile covers everything else that speaks the standard host and sensor MIBs. You do not pick a profile; the device's own identity decides.
Switching it on
Device health rides on the SNMP settings you already have. In Settings > Network monitoring > Probers, edit a probe: with Poll interface counters over SNMP on, tick Read device and radio health and pick how often (every 5 minutes is the default; 1 to 15 minutes). The probe then reads every device on the map it can reach with the SNMP profile that device uses.
SNMP profiles live in Settings > Network monitoring > SNMP profiles and can be SNMP v1, v2c or v3. Use v1 only for older radios and switches that answer nothing newer: the probe then reads them with slower one-by-one walks, and fields a device does not have are skipped instead of failing the whole reading.
A single device can be left out: its host page has an SNMP health switch in Details.
Where you see it
On a host page
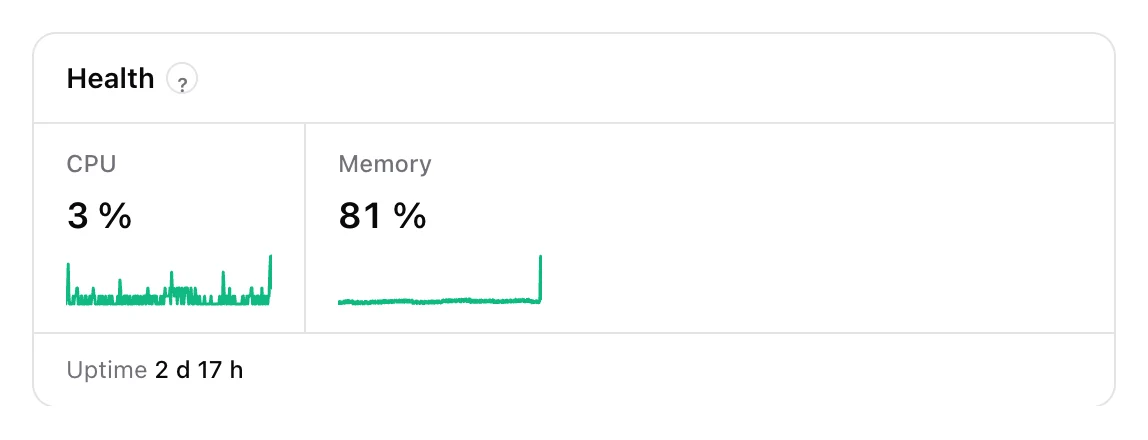
A monitored device shows a Health card: CPU, memory, temperature and voltage, each with the last 24 hours as a line, its uptime and when it last restarted, and its optics. An access point also shows a Radio card with its signal figures and its customer radios, weakest first, each with the customer it belongs to and a mark when it has been under the weak-signal line for three polls in a row.
The restart is read from the uptime, so you see it even for a device that does not send its logs anywhere.
For a customer
A customer's host page and the client page show their own radio as the access point hears it: signal and SNR now against the -75 dBm line, the access point, the rates and a week of signal. A radio is matched to a customer by the MAC address on their service, a DHCP lease, a customer radio drawn on the map, or the radio's address; a radio that could belong to two customers is left unmatched rather than guessed.
Weak customer radios
Network Map > Monitoring > Hosts has a Weak signal filter for customers whose radio has been weak for three polls in a row, with the count on the button. It is the list to plan a day of re-aiming dishes from.
Alerts
Six alert presets come with it, editable in Settings > Network monitoring > Policies:
- Running too hot, with a limit per make (a MikroTik CCR runs hot all day, a PMP 450 does not).
- CPU at its ceiling for three polls in a row.
- Unstable power: voltage outside any sensible supply range, a dip well under the device's own week, or a failed power supply.
- Restarted, read from the uptime.
- Optic losing light: receive power low, falling, or gone.
- Weak customer signal, on customer radios.
Better diagnoses
With the radio figures in hand, a degraded wireless link is judged by its radios against their own week (signal or SNR down 6 dB, noise up 6 dB, CCQ down 15 points, capacity down 30 %) instead of guessed from latency. Three diagnoses exist only because of device health: overheating, unstable power and a degrading optic. A customer whose own radio is weak gets the advice "re-aim the dish" rather than "check the link".
Good to know
- Readings are written to the probe's own disk first and shipped from there, like the pings, so an internet outage leaves no gap.
- The panel keeps the raw readings for 7 days and hourly minimum, average and maximum for two years.
- MikroTik access points with the RouterOS 7
wifipackage list their customer radios through the RouterOS API instead of SNMP; any router with API credentials in the panel is read that way every five minutes. - A device's uptime counter starts again at zero after 497 days. That is not counted as a restart.